Remove 2000 Remove Industry Remove Ozone Remove Parts
article thumbnail

TOAR shows present-day global ozone distribution and trends relevant to health; public database

Green Car Congress

Ozone levels across much of North America and Europe dropped significantly between 2000 and 2014. People living in parts of southern Europe, South Korea and southern Japan and China also experienced more than 15 days a year of ozone levels above 70 ppb. Source: University of Leicester. Click to enlarge.

Ozone 255
article thumbnail

EPA proposes approval of new ozone plans for the two of the worst Air Quality Zones in US: California’s San Joaquin Valley and South Coast

Green Car Congress

US EPA Region 9 8-hour ozone trends, 1979-2000. These State Implementation Plans (SIPs) are the roadmaps to meeting the 1997 8-hour ozone National Ambient Air Quality Standards (NAAQS) of 0.08 parts per million (ppm) by 2024. Source: EPA. Click to enlarge. In 2008, the 8-hour standard was lowered to 0.075 ppm.

Ozone 236
article thumbnail

Reducing Black Carbon Emissions and Ground-Level Ozone Would Provide Immediate Benefit Against Climate Change

Green Car Congress

Reducing emissions of black carbon soot and ground-level ozone would quickly make a considerable dent in the climate change problem and would also contribute to public health and protect crop yields, according to an essay in the September/October issue of Foreign Affairs. Besides a danger to breathe, ozone lowers crop yields.

article thumbnail

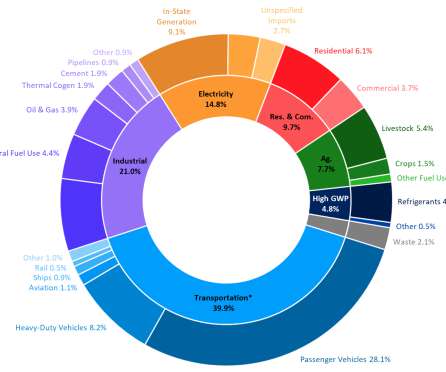
Latest GHG Inventory shows California remains below 2020 emissions target; much steeper rate of GHG reductions required

Green Car Congress

in 2018 (2000-2018 average year-over-year increase is 6.8%), continuing the increasing trend as they replace Ozone Depleting Substances (ODS) being phased out under the 1987 Montreal Protocol. These programs cover transportation fuels, industrial emissions, vehicle emissions and emissions from electricity generation.

2020 221
article thumbnail

MIT study says combustion emissions cause ~200,000 premature deaths/year in US; vehicles and power generation top sources

Green Car Congress

Annual average concentrations of fine particulates from US sources of combustion emissions from (a) electric power generation; (b) industry; (c) commercial and residential sources; (d) road transportation; (e) marine transportation; (f) rail transportation; (g) sum of all combustion sources; (h) all sources. Source: MIT. Click to enlarge.

MIT 378
article thumbnail

EEA report finds most Europeans in cities still exposed to levels of air pollution exceeding WHO guidelines

Green Car Congress

Among the findings: Concentrations of particulate matter (PM) continued to exceed the EU limit values and the WHO AQGs in large parts of Europe in 2017. 20 % of stations registered concentrations above the EU ozone (O 3 ) target value for the protection of human health. For PM with a diameter of 10 ?m

Pollution 170
article thumbnail

US NOx Cap and Trade Program Lowers Smog Levels in Eastern United States

Green Car Congress

The existing US NO x cap-and-trade program lowered 2008 summertime NO x emissions from power plants and large industrial sources 62% compared to year 2000 levels and 75% lower than in 1990, according to a report released by the US Environmental Protection Agency (EPA). Source: EPA. Click to enlarge.