Remove Congress Remove Economy Remove MPG Remove SUV
article thumbnail

Actual fuel economy of cars and light trucks: 1966-2019

Green Car Congress

vehicle fuel economy. Specifically, this study examines actual fuel economy of cars and light trucks (pickup trucks, SUVs, and vans) from 1966 through 2019. (My Calculated vehicle fuel economy is available going back to 1923. The graph below shows the changes in actual vehicle fuel economy from 1966 through 2019.

article thumbnail

EPA: preliminary data show average fuel economy of new light-duty vehicles reached a record high of 25.7 MPG in 2020

Green Car Congress

Preliminary data in EPA’s 2020 Automotive Trends Report shows average fuel economy for model year 2020 light-duty vehicles increased to 25.7 miles per gallon (MPG). If this preliminary data holds, that will be a new record high for average new light-duty vehicle fuel economy. From 2005–2020 average fuel economy rose by 29%.

article thumbnail

Actual fuel economy of cars and light trucks: 1966-2017

Green Car Congress

vehicle fuel economy. Specifically, this study examines actual fuel economy of cars and light trucks (pickup trucks, SUVs, and vans) from 1966 through 2017. Calculated vehicle fuel economy is available going back to 1923. The graph below shows the changes in actual vehicle fuel economy from 1966 through 2017.

article thumbnail

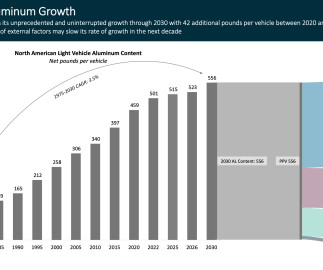
Ducker survey of automakers suggests aluminum content surge in EV market; SUVs & pickups to constitute 85% of the BEV market by 2030

Green Car Congress

Aggressive CO 2 and Miles Per Gallon (MPG) regulatory targets helping drive EV adoption and aluminum growth. Recent federal regulation ushering in more stringent CO 2 and MPG targets expected for 2027 to 2030 incentivizes EV adoption and helps further drive aluminum growth.

Market 449
article thumbnail

EPA fuel economy report finds weight and power leveling off, footprint stable

Green Car Congress

EPA recently released the latest edition of its annual report Light-Duty Automotive Technology, Carbon Dioxide Emissions and Fuel Economy Trends. The report is the authoritative reference for real-world fuel economy, technology trends and tailpipe carbon dioxide emissions, for new personal vehicles sold in the US every year since 1975.

article thumbnail

EPA’s annual automotive trends report shows slight increase in fuel economy from MY2017 to MY2018

Green Car Congress

In the US, Model Year (MY) 2018 vehicle fuel economy was 25.1 Since MY 2004, CO 2 emissions have decreased 23%, or 108 g/mi, and fuel economy has increased 30%, or 5.8 Average estimated real-world CO 2 emissions are projected to fall 6 g/mi to 346 g/mi and fuel economy is projected to increase 0.4 miles per gallon, 0.8%

article thumbnail

More people in the vehicle means less fuel use per person: Comparing SUVs and cars

Green Car Congress

Compared with cars, SUVs consume more energy per vehicle mile. Consequently, SUVs emit more carbon dioxide per vehicle mile than do cars. However, in the United States, the typical occupancy is higher for SUVs than for cars. Given that the difference in the average occupancy between SUVs and cars is 0.29

Personal 268