Remove Global Remove Industry Remove South Africa Remove Statistics
article thumbnail

TOAR shows present-day global ozone distribution and trends relevant to health; public database

Green Car Congress

People living in parts of southern Europe, South Korea and southern Japan and China also experienced more than 15 days a year of ozone levels above 70 ppb. Statistical analysis was carried out on the data, in order to calculate peak and high ozone levels and to interpret trends and changes in the data. Source: University of Leicester.

Ozone 255
article thumbnail

Study measures the effect of regional change in clouds caused by ships’ emissions; masking GHG warming

Green Car Congress

Satellite data over a shipping lane in the south Atlantic show that the ships modify clouds to block an additional 2 Watts of solar energy, on average, from reaching each square meter of ocean surface near the shipping lane. The difference helps explain how much industrial pollution influences clouds. NASA Earth Observatory.

Emissions 223
article thumbnail

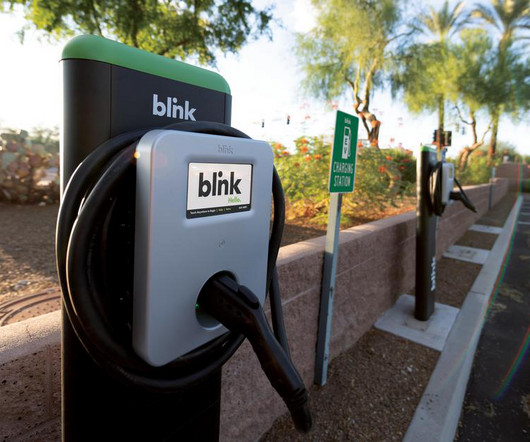
The Global Outlook of Electric Vehicles

Blink Charging

Perhaps nothing illustrates the rise of electric vehicles over the past decade more than this statistic: In 2012, the total number of electric vehicles (EVs) sold in the entire world was 120,000. Needless to say, EV sales are increasing globally. In 2021, more EVs than that were sold each week.

article thumbnail

USGS records nonfuel mineral production jump of $3.6B in 2022

Green Car Congress

billion value of nonfuel mineral commodities produced by US mines in 2022 included other industrial minerals and natural aggregates, as well as ferrous and nonferrous metals. The estimated value of US production of all industrial minerals in 2022 was $63.5 US mines produced approximately $98.2 Critical minerals.

article thumbnail

Development of autonomous cars is steadily progressing with AI as an accelerator, says Sven Lanwer, XC expert from Bosch – ET Auto

Baua Electric

And statistics show clearly that it’s a great help. in terms of coming to L1, L2 and L3 globally versus the Indian market, what is the gap? You have said that it’s not very cheap to implement ADAS, especially in countries like India or developing countries like Brazil or South Africa. I can only guess.

Auto 52
article thumbnail

EV Charging: A Look at the International Landscape

EV Connect

Where does the global EV market stand? Massive Uptick in EV Sales Global EV sales showed substantial growth in 2020, rising by 39%. Further, the report predicts that by 2030, EVs will represent nearly half of all global vehicle sales. South Africa, the European Union and the U.S. In the U.S.,