Remove 2000 Remove 2018 Remove Global Remove Ozone
article thumbnail

TOAR shows present-day global ozone distribution and trends relevant to health; public database

Green Car Congress

Ozone levels across much of North America and Europe dropped significantly between 2000 and 2014. People living in parts of southern Europe, South Korea and southern Japan and China also experienced more than 15 days a year of ozone levels above 70 ppb. Source: University of Leicester. Click to enlarge.

Ozone 255
article thumbnail

Study: 2/3 of aviation climate impact due to emissions other than CO2

Green Car Congress

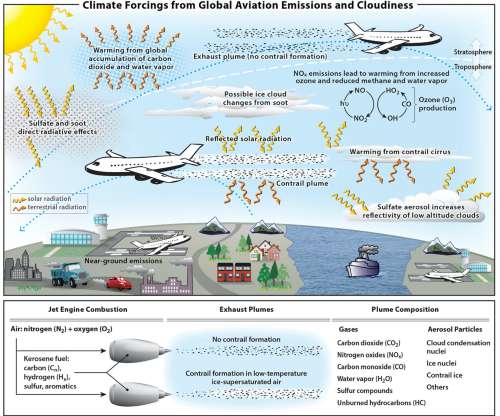
In the new study, we have analyzed 20 years of aviation emissions, up until and including 2018. Net warming from NO x emissions is a sum over warming (short-term ozone increase) and cooling (decreases in methane and stratospheric water vapor, and a long-term decrease in ozone) terms. For 2018 the net aviation ERF is +100.9

Climate 448
article thumbnail

Latest GHG Inventory shows California remains below 2020 emissions target; much steeper rate of GHG reductions required

Green Car Congress

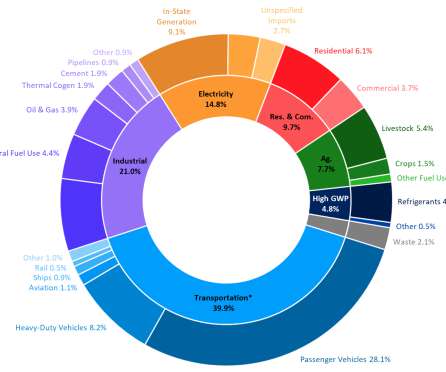
The California Air Resources Board released GHG emissions data for 2018 showing that emissions remain below 1990 levels but are effectively flat compared to 2017, while the economy grew by 4.3%. Total statewide 2018 GHG emissions were 425.3 million metric tons between 2017 and 2018, the first such decline since 2013.

2020 221
article thumbnail

HEI: 95%+ of world’s population live in areas of unhealthy air

Green Car Congress

Seven billion people, more than 95% of the world’s population, lived in areas exceeding the WHO Guideline for healthy air in 2016, according to a new global study. State of Global Air 2018. Population-weighted seasonal average ozone concentrations in 2016. State of Global Air 2018. State of Global Air 2018.

Pollution 218
article thumbnail

California Air Resources Board posts revised draft of strategy to reduce “Super Pollutants”

Green Car Congress

SLCPs are a category of pollutants which remain in the atmosphere for a relatively brief period, but have global warming potentials that are much higher than those of CO 2. SLCPs may account for an estimated 40% of global warming, increasing the impacts of climate change. CO 2 remains in the atmosphere for up to a century.

Pollution 150