Remove 2019 Remove Miles Remove Statistics Remove Universal
article thumbnail

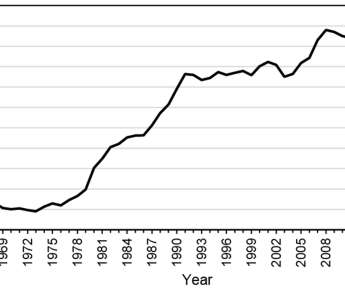
Actual fuel economy of cars and light trucks: 1966-2019

Green Car Congress

Specifically, this study examines actual fuel economy of cars and light trucks (pickup trucks, SUVs, and vans) from 1966 through 2019. (My The primary measure in this analysis is the average miles driven per gallon of fuel for each year. Annual statistics from the U.S. A minor increase between 2008 and 2019 (from 21.8

article thumbnail

Those who flew in 2020 had twice the environmental impact of those in 2019

Green Car Congress

The energy intensity of a transportation mode is calculated by dividing the amount of fuel used by the number of passenger miles traveled and converting the result into a common measure—Btu (British thermal units) per passenger mile traveled. Energy intensities of flying and driving, in Btu per passenger mile. in 2019 to 58.9%

2019 313
article thumbnail

Gasoline consumption per capita in 2020 was on par with that in 1965

Green Car Congress

Because of the pandemic, there was a substantial reduction in 2020 in vehicle miles traveled. The biggest drop was in April 2020 (a reduction of 40% compared with April 2019) followed by a gradual rebound later in the year. In December 2020, the reduction was 11% compared with December 2019. Total consumption.

2020 415
article thumbnail

Domestic flights are as full as they were before the pandemic

Green Car Congress

In terms of revenue passenger miles (for domestic flights) the lowest point was reached in April 2020 ( down 96% from April 2019). August travel data (the latest available) show that, compared with August 2019 data, there has been a decline of 8% (all corrected for population). 2020 minus 2019. 2021 minus 2019.

2019 210
article thumbnail

Up-to-date information on the rebound in flying in the United States

Green Car Congress

Among the variables included in my ongoing monthly monitoring of key transportation indexes is revenue passenger miles for domestic flying. However, the underlying data for that analysis (from the Bureau of Transportation Statistics ) are published with a substantial lag. January 2020. +5. February 2020. +3. March 2020. -51.

article thumbnail

Flying declined substantially more than driving during the current pandemic

Green Car Congress

In this brief note, I examine the distances traveled by flying and driving in the United States in March and April 2020—the first two months of the current pandemic—and compare them with the corresponding distances in March and April 2019. The results are shown in the table below.