Remove 2000 Remove 2017 Remove Gas Remove Ozone
article thumbnail

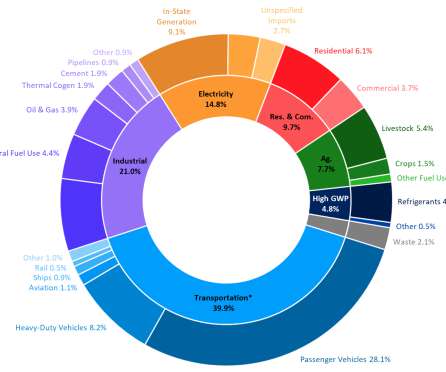
California 2017 GHG inventory shows 1.2% total drop from 2016; transportation sector emissions up 1%

Green Car Congress

The California Air Resources Board’s latest state inventory of greenhouse gas emissions shows that California’s GHG emissions continue to decrease. Changes in emissions by Scoping Plan sector between 2000 and 2017. 2017 GHG Emissions by Scoping Plan Sector and Sub-Sector Category. MMTCO 2 e (6%) from 2013 to 2017.

2017 230
article thumbnail

Latest GHG Inventory shows California remains below 2020 emissions target; much steeper rate of GHG reductions required

Green Car Congress

California’s latest greenhouse gas data shows that while the state continues to stay below its 2020 target for emissions, there is much more work to do to achieve carbon neutrality by 2045. million metric tons in 2017. million metric tons between 2017 and 2018, the first such decline since 2013. tons per person to 10.7

2020 221
article thumbnail

EEA report finds most Europeans in cities still exposed to levels of air pollution exceeding WHO guidelines

Green Car Congress

The new EEA analysis is based on the latest official air quality data from more than 4,000 monitoring stations across Europe in 2017. Among the findings: Concentrations of particulate matter (PM) continued to exceed the EU limit values and the WHO AQGs in large parts of Europe in 2017. For PM with a diameter of 10 ?m

Pollution 170
article thumbnail

California Air Resources Board posts revised draft of strategy to reduce “Super Pollutants”

Green Car Congress

California has already cut anthropogenic black carbon emissions by more than 90% since the 1960s, and existing measures are projected to cut mobile source emissions by 75% and total anthropogenic emissions by nearly 60% between 2000 and 2020. CO 2 remains in the atmosphere for up to a century.

Pollution 150