Remove Comparison Remove Environment Remove Re-Charge Remove Statistics
article thumbnail

NEDC Vs WLTP: How EV Ranges Are Estimated Around The Globe & Why Bother About The Tests

Get Electric Vehicle

This test cycle is not only outdated but it is also seen negatively due to its lab-based methodology, which gathers data in controlled environments instead of real-world driving scenarios. In comparison to the NEDC, the WLTP tests cars at faster speeds, different shift points, and more realistic temperatures.

Range 40
article thumbnail

Using the PHEV (Plug-In Hybrid Electric Vehicle) to Transition Society Seamlessly and Profitably From Fossil Fuel to 100% Renewable Energy

Green Car Congress

Appendix B: Car of the Future: A Comparison of Alternative Vehicles. Appendix D: Vehicle Driving Statistics. Appendix E: PHEV and the Electrical Grid—fast charge v. slow charge. With this charge it can travel an average daily distance of about 30 miles (50 km), which is often enough to serve most consumers’ needs.

PHEV 150
article thumbnail

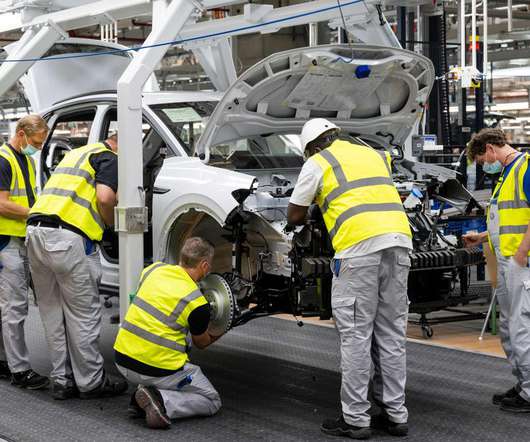
The EV Transition Explained: Reshaping Labor Markets

Cars That Think

Electric vehicles require new or re-tooled factories , each requiring thousands of employees. For instance, an in-depth study by Princeton University’s Andlinger Center for Energy and the Environment assessed different U.S. Better statistics are needed. Each mine and factory will need hundreds of workers to operate them.

Market 92