article thumbnail

EPA GHG Inventory shows US GHG down 1.7% y-o-y in 2019, down 13% from 2005

Green Car Congress

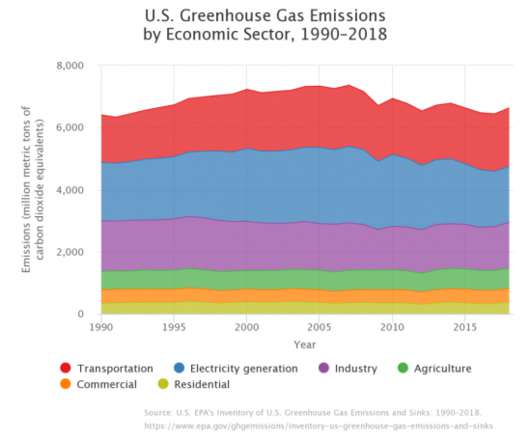
This decrease was driven largely by a decrease in emissions from fossil fuel combustion resulting from a decrease in total energy use in 2019 compared to 2018 and a continued shift from coal to natural gas and renewables in the electric power sector. CO 2 emissions decreased 2.2% from 2018 to 2019. over the same period. Source; EPA.

2005 418
article thumbnail

EPA: US GHG fell 0.5% y-o-y in 2017; power sector down by 4.2%, transportation up 1.21%

Green Car Congress

lower in 2017 than the prior year (after accounting for sequestration from the land sector), and power sector emissions fell 4.2%, according to the 2019 edition of the US Environmental Protection Agency’s (EPA) annual report on greenhouse gas (GHG) emissions. Year-over-year, US greenhouse gas emissions were 0.5%

2017 199
article thumbnail

Rhodium Group estimates US GHG emissions rose 1.3% in 2022

Green Car Congress

This reversal in 2022 was primarily driven by a drop in emissions from the electric power sector, mostly due to the displacement of coal by natural gas and an increase in renewable energy. Outside of the power sector, emissions increased slightly. below 2005 levels. In 2022, emissions reached only 15.5%

Emissions 273
article thumbnail

China’s 2005 Carbon Emissions Almost Twice As Much As 2002 Emissions

Green Car Congress

Carbon emissions associated with increased exports from China (left), as part of a more systematic view of increased national emissions (right), 2002 to 2005. Researchers from Norway, the United Kingdom, and the United States, estimated in the study that China’s 2005 carbon emissions were 80.59% or more higher than 2002 emissions. “

2002 170
article thumbnail

EPA annual inventory shows US GHG up 3.1% from 2017-2018

Green Car Congress

This increase was largely driven by an increase in emissions from fossil fuel combustion, which was a result of multiple factors, including more electricity use greater due to greater heating and cooling needs due to a colder winter and hotter summer in 2018 in comparison to 2017. Source: EPA. >.

2018 243
article thumbnail

Report finds that total transportation energy demand in California in 2050 could be reduced 30% relative to 2005

Green Car Congress

Total transportation fuel use in California broken down by subsector and fuel type for each scenario: business-as-usual (BAU); plug-in electric vehicles (PEVs); and combined PEVs and fuel cell vehicles (FCVs). Source: Yang et al. Click to enlarge. —Yang et al. Maximum fleet share for PEVs appears to be limited due to two factors.

2005 250
article thumbnail

EPA: US GHG emissions in 2017 down 0.3% from 2016

Green Car Congress

The decrease in CO 2 emissions from fossil fuel combustion was a result of multiple factors, including a continued shift from coal to natural gas, increased use of renewables in the electric power sector, and milder weather that contributed to less overall electricity use. below 2005 levels. above 1990 levels in 2007.

2017 262