article thumbnail

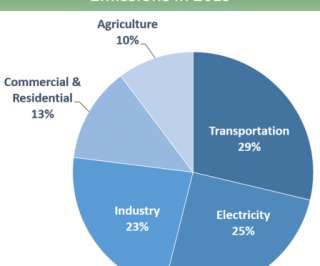
EPA GHG Inventory shows US GHG down 1.7% y-o-y in 2019, down 13% from 2005

Green Car Congress

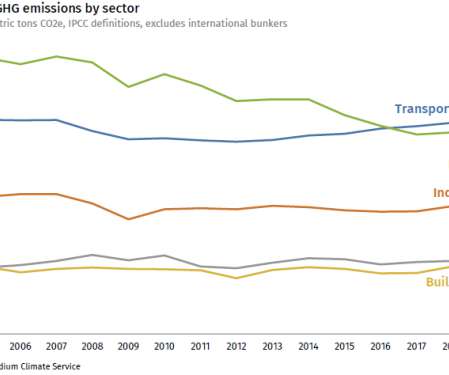
This decrease was driven largely by a decrease in emissions from fossil fuel combustion resulting from a decrease in total energy use in 2019 compared to 2018 and a continued shift from coal to natural gas and renewables in the electric power sector. The number of vehicle miles traveled (VMT) by light-duty vehicles (i.e.,

2005 418
article thumbnail

Rhodium Group estimates US GHG fell 2.1% in 2019, driven by coal decline

Green Car Congress

This decline was due almost entirely to a drop in coal consumption. Coal-fired power generation fell by a record 18% year-on-year to its lowest level since 1975. An increase in natural gas generation offset some of the climate gains from this coal decline, but overall power sector emissions still decreased by almost 10%.

Coal 370
article thumbnail

Canada targets cutting GHGs 30% below 2005 levels by 2030; new regulations for oil and gas, power, petrochemicals

Green Car Congress

Canada Environment Minister Leona Aglukkaq announced that Canada plans to reduce its greenhouse gas (GHG) emissions by 30% below 2005 levels by 2030. Regulations for natural gas-fired electricity, which would build on Canada’s existing coal-fired electricity regulations. lower than 2005 levels while the economy grew by 12.9%

2005 150
article thumbnail

EPA: US greenhouse gases dropped 3.4% in 2012 from 2011; down 10% from 2005 levels

Green Car Congress

According to the report, GHG emissions in 2012 showed a 10% drop below 2005 levels, and were only slightly above the emissions in 1994 (6,520 million metric tons). These gases include carbon dioxide, methane, nitrous oxide, hydrofluorocarbons, perfluorocarbons and sulfur hexafluoride. Source: EPA. Click to enlarge. Tg CO 2 Eq.

2005 252
article thumbnail

EPA: US greenhouse gases up 2% in 2013; increased coal consumption, cool winter

Green Car Congress

The increase from 2012 to 2013 was due to an increase in the carbon intensity of fuels consumed to generate electricity due to an increase in coal consumption, with decreased natural gas consumption, according to the report. Total US emissions have increased by 5.9% from 1990 to 2013. The transportation end-use sector accounted for 1,743.0

2013 150
article thumbnail

EPA: US GHG fell 0.5% y-o-y in 2017; power sector down by 4.2%, transportation up 1.21%

Green Car Congress

This decrease was largely driven by a decrease in emissions from fossil fuel combustion, which was a result of multiple factors including a continued shift from coal to natural gas and increased use of renewables in the electric power sector, and milder weather that contributed to less overall electricity use.

2017 199
article thumbnail

EIA: light duty vehicle energy consumption to drop 25% by 2040; increased oil production, vehicle efficiency reduce US oil and liquid imports

Green Car Congress

Energy consumption by light-duty vehicles in the United States, AEO2013 and AEO2014, 1995-2040 (quadrillion Btu). As a result, annual increases in vehicle miles traveled (VMT) in LDVs average 0.9% New vehicle sales shares are generally similar in AEO2014 and AEO2013 but with moderate variation. quadrillion Btu in 2012 to 12.1

Oil 290