Remove 2005 Remove Climate Change Remove Coal Remove Economy
article thumbnail

EPA GHG Inventory shows US GHG down 1.7% y-o-y in 2019, down 13% from 2005

Green Car Congress

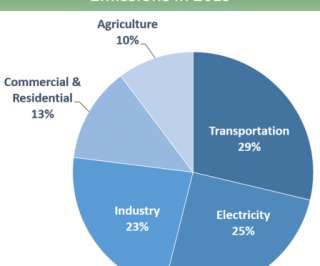
This decrease was driven largely by a decrease in emissions from fossil fuel combustion resulting from a decrease in total energy use in 2019 compared to 2018 and a continued shift from coal to natural gas and renewables in the electric power sector. CO 2 emissions decreased 2.2% from 2018 to 2019. Total GHG emissions in 2019 were up 1.8%

2005 418
article thumbnail

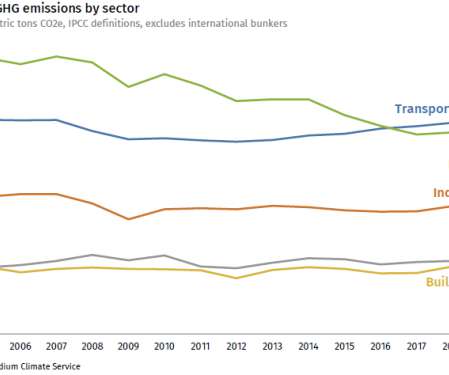
Rhodium Group estimates US GHG fell 2.1% in 2019, driven by coal decline

Green Car Congress

This decline was due almost entirely to a drop in coal consumption. Coal-fired power generation fell by a record 18% year-on-year to its lowest level since 1975. An increase in natural gas generation offset some of the climate gains from this coal decline, but overall power sector emissions still decreased by almost 10%.

Coal 370
article thumbnail

MIT report finds China’s actions on climate change crucial; argues for global economy-wide greenhouse gas tax

Green Car Congress

A new report from the MIT Joint Program on the Science and Policy of Global Change shows the importance of all major nations taking part in global efforts to reduce emissions—and in particular, finds China’s role to be crucial. The researchers argue for a global economy-wide greenhouse gas tax that spreads the burden of responsibility.

article thumbnail

Canada targets cutting GHGs 30% below 2005 levels by 2030; new regulations for oil and gas, power, petrochemicals

Green Car Congress

Canada Environment Minister Leona Aglukkaq announced that Canada plans to reduce its greenhouse gas (GHG) emissions by 30% below 2005 levels by 2030. Canada formally submitted its target, referred to as an Intended Nationally Determined Contribution (INDC), to the United Nations Framework Convention on Climate Change.

2005 150
article thumbnail

EPA: US greenhouse gases dropped 3.4% in 2012 from 2011; down 10% from 2005 levels

Green Car Congress

Greenhouse Gas Emissions and Sinks , which is submitted annually to the Secretariat of the United Nations Framework Convention on Climate Change, presents a national-level overview of annual greenhouse gas emissions since 1990. Climate Change Emissions' decrease in 2012 from 2011. The Inventory of U.S. Source: EPA.

2005 252
article thumbnail

EPA: US greenhouse gases up 2% in 2013; increased coal consumption, cool winter

Green Car Congress

The increase from 2012 to 2013 was due to an increase in the carbon intensity of fuels consumed to generate electricity due to an increase in coal consumption, with decreased natural gas consumption, according to the report. Climate Change Emissions' Total US emissions have increased by 5.9% from 1990 to 2013.

2013 150
article thumbnail

EIA: US energy-related CO2 emissions down 1.7% in 2016; carbon intensity of economy down 3.1%; transportation emissions up

Green Car Congress

decline in energy intensity of the economy (Btu/GDP). Combining these two factors, the overall carbon intensity of the economy (CO 2 /GDP) declined by 3.1%. Emissions have declined in 6 out of the past 10 years, and energy‐related CO 2 emissions in 2016 were 823 MMmt (14%) below 2005 levels, according to the EIA. along with a 1.4%

2016 150