Remove 2005 Remove Cars Remove Coal Remove Gasoline
article thumbnail

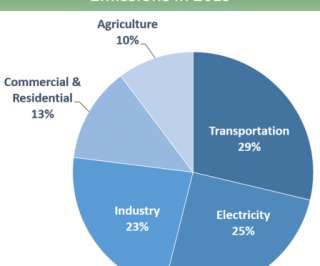
EPA GHG Inventory shows US GHG down 1.7% y-o-y in 2019, down 13% from 2005

Green Car Congress

This decrease was driven largely by a decrease in emissions from fossil fuel combustion resulting from a decrease in total energy use in 2019 compared to 2018 and a continued shift from coal to natural gas and renewables in the electric power sector. CO 2 emissions decreased 2.2% from 2018 to 2019. Total GHG emissions in 2019 were up 1.8%

2005 418
article thumbnail

EPA: US greenhouse gases dropped 3.4% in 2012 from 2011; down 10% from 2005 levels

Green Car Congress

According to the report, GHG emissions in 2012 showed a 10% drop below 2005 levels, and were only slightly above the emissions in 1994 (6,520 million metric tons). Carbon dioxide emissions from passenger cars and light-duty trucks totaled 1,061.0 CO 2 emissions from passenger cars and light-duty trucks peaked at 1,184.3

2005 252
article thumbnail

EPA: US GHG emissions in 2017 down 0.3% from 2016

Green Car Congress

The decrease in CO 2 emissions from fossil fuel combustion was a result of multiple factors, including a continued shift from coal to natural gas, increased use of renewables in the electric power sector, and milder weather that contributed to less overall electricity use. below 2005 levels. above 1990 levels in 2007. Transportation.

2017 262
article thumbnail

EPA: US GHG fell 0.5% y-o-y in 2017; power sector down by 4.2%, transportation up 1.21%

Green Car Congress

This decrease was largely driven by a decrease in emissions from fossil fuel combustion, which was a result of multiple factors including a continued shift from coal to natural gas and increased use of renewables in the electric power sector, and milder weather that contributed to less overall electricity use.

2017 199
article thumbnail

Global Carbon Project: Global carbon emissions growth slows, but hits record high

Green Car Congress

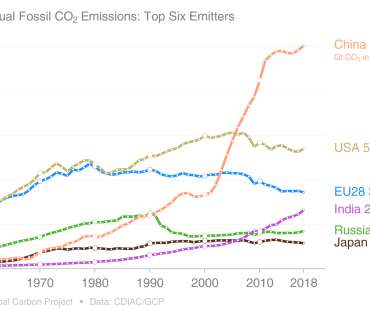
The decline of coal use in the European Union and United States is overshadowed by surging natural gas and oil use around the world, according to the researchers. About 40% of global carbon dioxide emissions were attributable to coal use, 34% from oil, 20% from natural gas, and the remaining 6% from cement production and other sources.

Carbon 195
article thumbnail

NASA satellite images highlight US air quality improvement with reduction of NO2

Green Car Congress

The gas is produced primarily during the combustion of gasoline in vehicle engines and coal in power plants. Nitrogen dioxide pollution, averaged yearly from 2005-2011, has decreased across the United States. Air pollution has decreased even though population and the number of cars on the roads have increased.

Ozone 210
article thumbnail

Berkeley Lab study forecasts China energy use will peak within 20 years; 356 million private cars by 2050

Green Car Congress

Projected saturation of private cars in China by fuel type under the two scenarios. There will come a time—within the next two decades—when the number of people in China acquiring cars, larger homes, and other accouterments of industrialized societies will peak—a phenomenon known as saturation. Source: LBL.

China 285