Remove 2000 Remove Climate Change Remove Gas-Electric Remove Oil
article thumbnail

USA & China Electricity Generation TWh & CO2e Trajectories Since 2000 Are Startling

CleanTechnica EVs

For a decade I’ve been tracking the exponential expansion of wind, solar, and to a lesser extent hydro electricity generation. continued] The post USA & China Electricity Generation TWh & CO2e Trajectories Since 2000 Are Startling appeared first on CleanTechnica.

2000 93
article thumbnail

PSI team develops web tool for consumers to compare environmental impact of passenger cars in detail

Green Car Congress

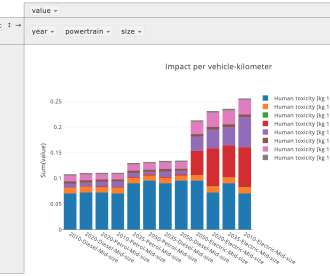
The system will graph lifecycle impact for a range of specified powertrains, for a large number of impact categories: Climate change [kg CO 2 -eq.]. Depletion of fossil energy resources [kg oil-eq.]. The top sample above shows climate change impact; the subsequent chart shows human toxicity. in review).

Mariner 435
article thumbnail

Study concludes abundant shale gas is neither climate hero nor villain; need for targeted GHG reduction policy

Green Car Congress

While natural gas can reduce greenhouse emissions when it is substituted for higher-emission energy sources, abundant shale gas is not likely to substantially alter total emissions without policies targeted at greenhouse gas reduction, according to a new study by two researchers at Duke University. —Newell and Raimi.

Climate 199
article thumbnail

U Chicago, MIT study suggests ongoing use of fossil fuels absent new carbon taxes

Green Car Congress

A paper by a team from the University of Chicago and MIT suggests that technology-driven cost reductions in fossil fuels will lead to the continued use of fossil fuels—oil, gas, and coal—unless governments pass new taxes on carbon emissions. for oil, 24% for coal, and 20% for natural gas.

Chicago 150
article thumbnail

PBL/JRC: Global CO2 emissions increase to new all-time record in 2013, but growth is slowing down

Green Car Congress

in 2012 was primarily due to a decline in electricity and fuel demand from the basic materials industry, and aided by an increase in renewable energy and by energy efficiency improvements. The consumption of oil products increased by 1.7% Climate Change Emissions' The much lower emissions increase in China of 4.2%

2013 240
article thumbnail

California 2017 GHG inventory shows 1.2% total drop from 2016; transportation sector emissions up 1%

Green Car Congress

The California Air Resources Board’s latest state inventory of greenhouse gas emissions shows that California’s GHG emissions continue to decrease. Changes in emissions by Scoping Plan sector between 2000 and 2017. It does not include emissions from petroleum refineries and oil production. Source: ARB. Source: ARB.

2017 230
article thumbnail

California Air Resources Board posts revised draft of strategy to reduce “Super Pollutants”

Green Car Congress

SLCPs may account for an estimated 40% of global warming, increasing the impacts of climate change. The major sources of methane in California are livestock (~30% of the state’s methane emissions), followed by landfills and oil and gas production. CO 2 remains in the atmosphere for up to a century.

Pollution 150