Remove Comparison Remove Gasoline Remove Gasoline-Electric Remove Oil
article thumbnail

Study finds GHG emissions from corn ethanol now 46% lower than gasoline

Green Car Congress

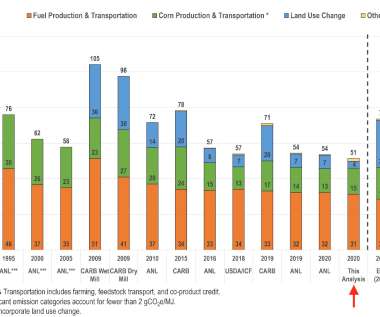
A new study by a team from Environmental Health & Engineering (EH&E) has found that greenhouse gas emissions from corn ethanol are 46% lower than those from gasoline—a decrease in emissions from the estimated 39% done by previous modeling. gCO 2 e/MJ) which is 46% lower than the average carbon intensity for neat gasoline.

Gasoline 493
article thumbnail

DOE launches “eGallon” to help compare cost of fueling with electricity vs. gasoline

Green Car Congress

The US Department of Energy (DOE) launched the “ eGallon ” as a quick and simple way for consumers to compare the costs of fueling electric vehicles vs. driving on gasoline. Today’s national average eGallon price is about $1.14, meaning that a typical electric vehicle could travel as far on $1.14 worth of gasoline.

article thumbnail

New lifecycle analysis of WTW GHG emissions of diesel and gasoline refined in US from Canadian oil sands crude

Green Car Congress

In a new, comprehensive study, a team from Argonne National Laboratory, Stanford University and UC Davis ITS has estimated the well-to-wheels (WTW) GHG emissions of US production of gasoline and diesel sourced from Canadian oil sands. g CO 2 e/MJ for US conventional crude oil recovery. This range can be compared to ∼4.4

Oil-Sands 150
article thumbnail

CMU study finds small battery PHEVs and gasoline hybrids the least-cost policy solution to reducing gasoline consumption

Green Car Congress

Comparison of current federal subsidy to base case assumptions showing lifetime fuel savings (HomeEve charging scenario). An EPA estimate based on the Chevy Volt’s reported efficiency is also included for comparison. Earlier post.). per gallon saved while subsidizing 16 kWh battery PHEVs at roughly $4.50

Gasoline 308
article thumbnail

Actual fuel economy of cars and light trucks: 1966-2019

Green Car Congress

In terms of fuel consumption per distance driven, the change between 1973 (the year of the first oil embargo) and 1991 (from 7.75 In comparison, the change between 2008 and 2019 (from 4.59 A minor increase between 2008 and 2019 (from 21.8 gallons per 100 miles to 5.10 gallons per 100 miles to 4.50

article thumbnail

Argonne study finds BEVs can have lowest scheduled maintenance costs, but highest cost of driving

Green Car Congress

The study considers five different powertrains (internal combustion engine, hybrid-electric, plug-in hybrid-electric, fuel-cell-electric, and battery-electric) and 12 cost components (purchase cost, depreciation, financing, fuel, insurance, maintenance, repair, taxes, registration fees, tolls and parking, payload capacity and labor).

article thumbnail

Actual fuel economy of cars and light trucks: 1966-2017

Green Car Congress

In terms of fuel consumption per distance driven, the change between 1973 (the year of the first oil embargo) and 1991 (from 7.75 In comparison, the change between 2008 and 2017 (from 4.59 A minor increase between 2008 and 2017 (from 21.8 gallons per 100 miles to 5.09 gallons per 100 miles to 4.48