article thumbnail

BP Statistical Review finds global oil share down for 12th year in a row, coal share up to highest level since 1969; renewables at 2%

Green Car Congress

seen in 2010, according to the newly released BP Statistical Review of World Energy, 2012. Oil demand grew by less than 1%—the slowest rate amongst fossil fuels—while gas grew by 2.2%, and coal was the only fossil fuel with above average annual consumption growth at 5.4% Click to enlarge. globally, and 8.4%

Coal 261
article thumbnail

New inventory of black carbon emissions from China finds 2007 levels higher than previously reported

Green Car Congress

A new black carbon (BC) emissions inventory from China found BC emissions levels in 2007 of 1,957 Gg BC—higher than reported in earlier studies. Black carbon is released into the atmosphere via incomplete combustion of carbonaceous fuel and is of major concern because of the impact on climate systems. Credit: ACS, Wang et al.

2007 271
article thumbnail

BP: world on unsustainable path; growing divergence between demands for climate change action and pace of progress

Green Car Congress

BP released the 68 th annual edition of the BP Statistical Review of World Energy (BP Stats Review), a comprehensive collection and analysis of global energy data. This year’s edition highlights the growing divergence between demands for action on climate change and the actual pace of progress on reducing carbon emissions.

article thumbnail

DOE Selects Seven Projects for University Coal Research Program

Green Car Congress

The US Department of Energy has selected 7 projects to participate in the University Coal Research (UCR) program. The projects aim to improve the basic understanding of the chemical and physical processes that govern coal conversion and utilization, by-product utilization, and technological development for advanced energy systems.

Coal 210
article thumbnail

Study finds 1.4 Gt discrepancy between national and provincial data sets for greenhouse gas emissions in China

Green Car Congress

The area chart shows the increase of CO 2 emissions calculated from the national energy statistics since 1997 broken down by different fuel type. The dashed line represents the aggregated CO2 emissions calculated from the provincial energy statistics 1997–2010. The column chart presents the 1.4? Source: Guan et al. Click to enlarge.

Emissions 218
article thumbnail

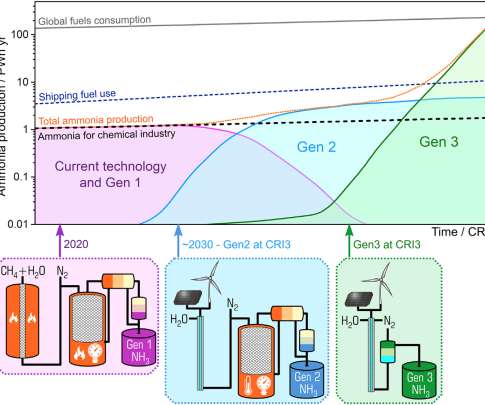
Monash team proposes roadmap to renewable ammonia economy; 3 generations of technology

Green Car Congress

The process generates H 2 from natural gas or coal through steam reforming and combines it with N 2 , which has been separated from air by a cryogenic process, to form NH 3. Gen 1 involves the use of carbon sequestration or offsets to bring the net carbon impact of the ammonia production to zero (blue ammonia). Generation 1.

Renewable 419
article thumbnail

Berkeley Lab releases 8th edition of databook on China’s energy and environment; finding the “missing” energy consumption

Green Car Congress

The China Energy Group of the US Department of Energy’s (DOE’s) Lawrence Berkeley National Laboratory (Berkeley Lab) recently released the eighth edition of the China Energy Databook —the most comprehensive publicly available resource known to exist covering China’s energy and environmental statistics. Click to enlarge.