article thumbnail

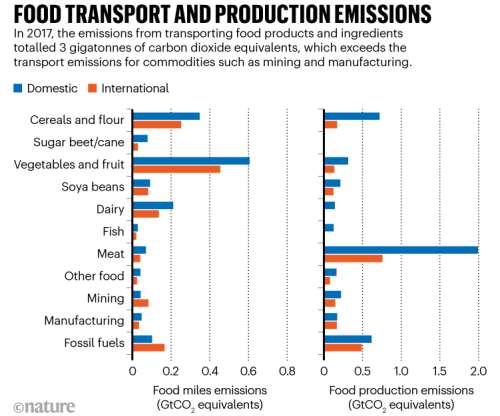
Study finds transporting food and ingredients generates 20% of carbon emissions in the global food system

Green Car Congress

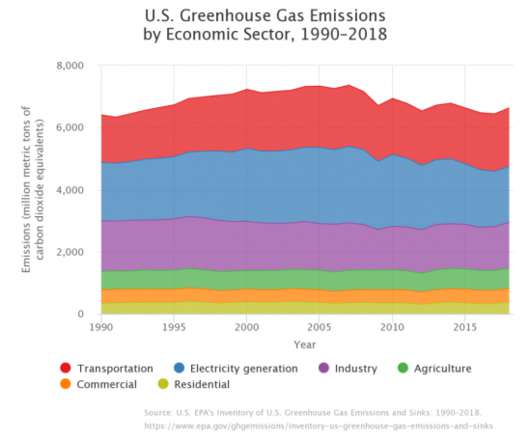
A study by researchers in Australia and China has determined that global food-miles account for nearly 20% of total food-systems emissions; moving fruit and vegetables in refrigerated vehicles is particularly emissions-intensive. We estimate the carbon footprint of food-miles by using a global multi-region accounting framework.

article thumbnail

Actual fuel economy of cars and light trucks: 1966-2017

Green Car Congress

Specifically, this study examines actual fuel economy of cars and light trucks (pickup trucks, SUVs, and vans) from 1966 through 2017. The primary measure in this analysis is the average miles driven per gallon of fuel for each year. Department of Transportation. A minor increase between 2008 and 2017 (from 21.8

article thumbnail

Average annual highway vehicle miles traveled per capita varies by state

Green Car Congress

On a per-capita basis, the number of vehicle-miles traveled (VMT) on the nation’s roads varies from a low of 5,300 annual miles in the District of Columbia to 16,900 annual miles in Wyoming. These data are for 2017, the most recent year for which vehicle miles of travel are available. Sources: VMT – U.S.

article thumbnail

Relationship between distance driven and economic activity: 1946-2017

Green Car Congress

This is the latest in my series of analyses on the relationship between road transportation and economic activity in the United States. For each year from 1946 through 2017, distance driven by all vehicles was obtained from the U.S. Department of Transportation , while GDP in chained 2012 dollars came from the U.S.

2017 268
article thumbnail

UK ONS report finds significant challenge remains to reduce road transport emissions; sector GHG emissions up 6% from 1990-2017

Green Car Congress

A new report by the UK’s Office for National Statistics (ONS) finds that greenhouse gas (GHG) emissions from road transport in the UK rose by 6% from 1990 to 2017. The increase—albeit lower than the increase in road traffic—highlights the significant challenge in reducing emissions from road transport, the report says.

2017 191
article thumbnail

EPA: US GHG fell 0.5% y-o-y in 2017; power sector down by 4.2%, transportation up 1.21%

Green Car Congress

lower in 2017 than the prior year (after accounting for sequestration from the land sector), and power sector emissions fell 4.2%, according to the 2019 edition of the US Environmental Protection Agency’s (EPA) annual report on greenhouse gas (GHG) emissions. In 2017, US greenhouse gas emissions totaled 6,456.7

2017 199
article thumbnail

EPA: US GHG emissions in 2017 down 0.3% from 2016

Green Car Congress

In 2017, total gross U.S. The decrease in total greenhouse gas emissions between 2016 and 2017 was driven in part by a decrease in CO 2 emissions from fossil fuel combustion. Relative to the 1990 baseline, gross emissions in 2017 were higher by 1.6%, down from a high of 15.7% Overall, net emissions in 2017 were 12.7%

2017 262