article thumbnail

Actual fuel economy of cars and light trucks: 1966-2017

Green Car Congress

Specifically, this study examines actual fuel economy of cars and light trucks (pickup trucks, SUVs, and vans) from 1966 through 2017. The primary measure in this analysis is the average miles driven per gallon of fuel for each year. Department of Transportation were the sources of the information for 1986 through 2017.

article thumbnail

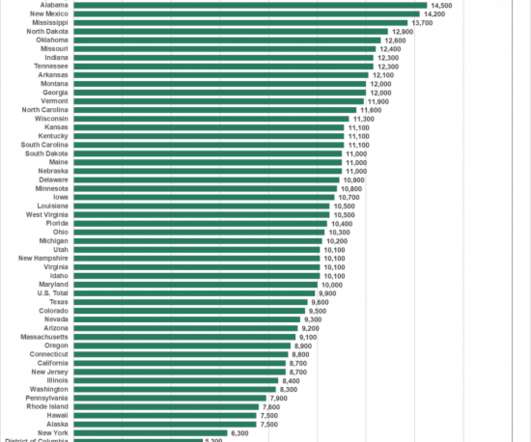
Average annual highway vehicle miles traveled per capita varies by state

Green Car Congress

On a per-capita basis, the number of vehicle-miles traveled (VMT) on the nation’s roads varies from a low of 5,300 annual miles in the District of Columbia to 16,900 annual miles in Wyoming. These data are for 2017, the most recent year for which vehicle miles of travel are available. Sources: VMT – U.S.

article thumbnail

Relationship between distance driven and economic activity: 1946-2017

Green Car Congress

For each year from 1946 through 2017, distance driven by all vehicles was obtained from the U.S. Thereafter, this measure increased until plateauing from the early 1970s through the early 1990s, and then decreased through 2017. miles per thousand dollars—was reached in 1976. miles per thousand dollars in 1946.

2017 268
article thumbnail

2017 Ford Fusion Energi PHEV boosts total range to 610 miles

Green Car Congress

Ford’s 2017 Fusion Energi—incorporating enhancements announced earlier this year at the Detroit Auto Show ( earlier post )—can travel 610 miles (982 km) on a full tank of gas and battery charge according to EPA estimates to be posted to fueleconomy.gov—the highest combined range of any plug-in hybrid sold in the US.

Fusion 199
article thumbnail

ExxonMobil announces 6th oil discovery offshore Guyana with Ranger-1; Guyana may move from non-producer to regional powerhouse

Oil (..)

article thumbnail

DOE: median EV range in US grew 56% from 73 miles in MY 2011 to 114 miles in MY 2017

Green Car Congress

From 2011 to 2017, the median of the all-electric vehicle ranges in the US increased by 41 miles, or 56%—from 73 to 114 miles— according to data gathered by the US Department of Energy (DOE). Source: DOE.

Miles 150
article thumbnail

EPA: US GHG emissions in 2017 down 0.3% from 2016

Green Car Congress

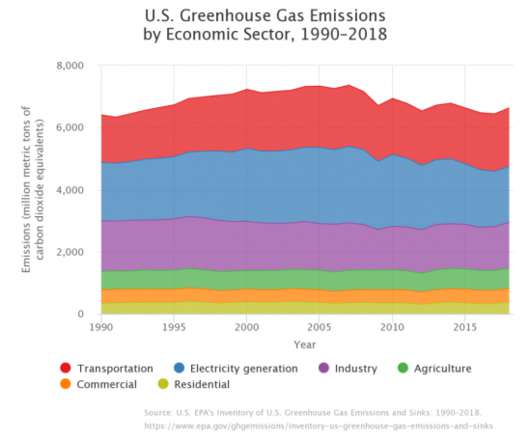
In 2017, total gross U.S. The decrease in total greenhouse gas emissions between 2016 and 2017 was driven in part by a decrease in CO 2 emissions from fossil fuel combustion. Relative to the 1990 baseline, gross emissions in 2017 were higher by 1.6%, down from a high of 15.7% Overall, net emissions in 2017 were 12.7%

2017 262