article thumbnail

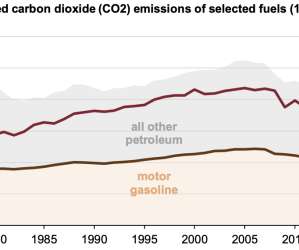
EIA: US energy-related CO2 fell by 2.8% in 2019, slightly below 2017 levels

Green Car Congress

The increase in 2018 was largely caused by increased energy use as a result of weather and was the largest increase in CO 2 emissions since 2010, when the US economy was recovering from an economic recession. In 2019, the transportation sector’s energy-related CO2 emissions declined by 0.7%

2019 273
article thumbnail

UK new car CO2 emissions fell 3.5% in 2010 and more than 20% since 2000

Green Car Congress

g/km CO 2 in 2010 according to the Society of Motor Manufacturers and Traders’ (SMMT) 10 th annual CO 2 report. The 2010 CO 2 emissions fall is one of the highest annual reductions on record but lower than the 5.4% It appears, though, that the rate of improvement in emissions slowed in the second-half of 2010.

2000 218
article thumbnail

Final EPA report shows total US GHG emissions up 3.2% in 2010, total CO2 up 3.5%, total transportation CO2 up 1%

Green Car Congress

The final report shows overall emissions in 2010 increased by 3.2% EPA attributes the trend to an increase in energy consumption across all economic sectors, due to increasing energy demand associated with an expanding economy, and increased demand for electricity for air conditioning due to warmer summer weather during 2010.

2010 252
article thumbnail

EIA: world energy consumption to grow 56% 2010-2040, CO2 up 46%; use of liquid fuels in transportation up 38%

Green Car Congress

World energy consumption by fuel type, 2010-2040. The US Energy Information Administration’s (EIA’s) International Energy Outlook 2013 (IEO2013) projects that world energy consumption will grow by 56% between 2010 and 2040, from 524 quadrillion British thermal units (Btu) to 820 quadrillion Btu. Source: IEO2013.

2010 317
article thumbnail

EIA releases report on CO2 emissions by state; California led in 2010 with transportation-sector emissions

Green Car Congress

Energy-related CO 2 emissions buy state, 2010. The US Energy Information Administration (EIA) has released a new report, State-Level Energy-Related Carbon Dioxide Emissions, 2000-2010. Topping the list for absolute emissions in 2010 was Texas (652.6 2010 state energy-related CO 2 emissions for transportation sector.

2010 236
article thumbnail

Nearly 76 Gigawatt-Hours of Battery Cells Produced in U.S.A 2010–2020

CleanTechnica EVs

Plug-in Vehicle Market from 2010 to 2020 Five companies (AESC, LG Chem, Panasonic, Samsung, and SK Innovation) produced almost all the battery cells used in plug-in vehicles for the U.S. Nearly 76 Gigawatt-hours of Battery Cell Capacity Was Produced for U.S. market over the past decade, with capacity totaling 75,933 megawatt-hours (MWh).

2010 145
article thumbnail

Volvo Car led CO2 reductions among European automakers in 2010 due partly to diesel success

Green Car Congress

2010 Fleet-average weight and fleet-average CO 2 emissions by carmaker, compared with EU target line. Europe’s eight largest carmakers cut their CO 2 emissions by an average of 2% to 6% in 2010. in 2010, and today the average figure for new cars sold in Europe is 140 grams per kilometer. Source: T&E. Click to enlarge.

2010 239