article thumbnail

Responsible Battery Coalition and U Michigan launch study to compare electric and gas vehicle lifetime costs

Green Car Congress

Our research partnership with RBC will enable us to conduct a more in-depth analysis of EV costs in comparison with internal combustion engine vehicles by considering vehicle type, user behavior, and where the vehicle is purchased and operated. Refueling patterns based on driver time valuation. Anticipated driving patterns.

Michigan 199
article thumbnail

ORNL researchers quantify the effect of increasing highway speed on fuel economy

Green Car Congress

Vehicle installed on the chassis dynamometer in the ORNL vehicle research laboratory. This website, jointly maintained by the US Department of Energy and the US Environmental Protection Agency (EPA), provides information such as official EPA “window label” fuel economy estimates for city, highway, and combined driving for all U.S.-legal

article thumbnail

NREL report on electric bus demo at Foothill Transit finds Proterra fuel economy >8x higher than CNG on same line

Green Car Congress

The CNG buses had an average fuel economy of 3.89 However, because Foothill Transit operates its BEB and CNG bus fleets differently, the efficiency results presented are not an apples-to-apples comparison. An apples-to-apples comparison of fuel cost—i.e., mpgge, equating to 4.34 Foothill Transit paid an average of $0.17/kWh

article thumbnail

ICCT provides policy update on proposed China Phase 4 fuel economy regulations

Green Car Congress

Comparison of global passenger vehicle fuel consumption standards normalized to NEDC L/100km. Comparison of overall and annual average fleet fuel consumption reduction rates under proposed or enacted standards across regions. Source: ICCT. Click to enlarge. 100km (34 mpg US) in 2015. annually—between 2015 and 2020. Source: ICCT.

article thumbnail

EPA trends report sees record levels of average new vehicle fuel economy and CO2 emissions for MY 2012; role of new gasoline vehicle technologies

Green Car Congress

EPA projects advanced transmissions (6+ speeds and CVTs), gasoline direct injection (GDI) systems, and turbocharged engines will be installed on at least 15% of all MY 2013 vehicles. MY 2012 adjusted fuel economy is 23.6 mpg fuel economy improvement from MY 2011 to MY 2012 is the second largest annual improvement in the last 30 years.

article thumbnail

ORNL researchers use stop-light cameras to reduce fuel consumption of less-efficient vehicles via traffic management

Green Car Congress

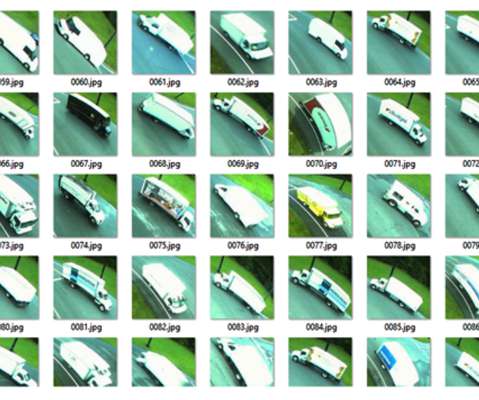
GRIDSMART’s camera systems are installed in 1,200 cities globally, replacing traditional ground sensors with overhead fisheye cameras that provide horizon-to-horizon vision tracking for optimal traffic-light actuation. Gee, “Estimating Vehicle Fuel Economy from Overhead Camera Imagery and Application for Traffic Control.” Karnowski, R.

Light 359
article thumbnail

New UMTRI paper reviews major advantages and disadvantages of battery-electric and fuel-cell vehicles

Green Car Congress

The team of Brandon Schoettle and Dr. Michael Sivak also incudes information for current gasoline-powered internal combustion engines as a baseline comparison. For current gasoline-powered ICE vehicles at an average fuel economy of 23.3 The cost of installing a gasoline station is typically in the range of $1 million to $2 million.

San Diego 150