Remove Comparison Remove Economy Remove Gasoline-Electric Remove Oil
article thumbnail

Actual fuel economy of cars and light trucks: 1966-2019

Green Car Congress

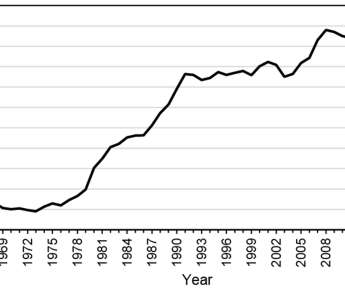
vehicle fuel economy. Specifically, this study examines actual fuel economy of cars and light trucks (pickup trucks, SUVs, and vans) from 1966 through 2019. (My Calculated vehicle fuel economy is available going back to 1923. The graph below shows the changes in actual vehicle fuel economy from 1966 through 2019.

article thumbnail

Actual fuel economy of cars and light trucks: 1966-2017

Green Car Congress

vehicle fuel economy. Specifically, this study examines actual fuel economy of cars and light trucks (pickup trucks, SUVs, and vans) from 1966 through 2017. Calculated vehicle fuel economy is available going back to 1923. For 1966 through 1985, fuel economy was calculated from the information in a summary publication by the U.S.

article thumbnail

Study finds GHG emissions from corn ethanol now 46% lower than gasoline

Green Car Congress

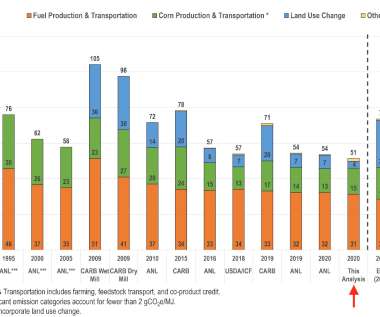
A new study by a team from Environmental Health & Engineering (EH&E) has found that greenhouse gas emissions from corn ethanol are 46% lower than those from gasoline—a decrease in emissions from the estimated 39% done by previous modeling. gCO 2 e/MJ) which is 46% lower than the average carbon intensity for neat gasoline.

Gasoline 493
article thumbnail

Argonne study finds BEVs can have lowest scheduled maintenance costs, but highest cost of driving

Green Car Congress

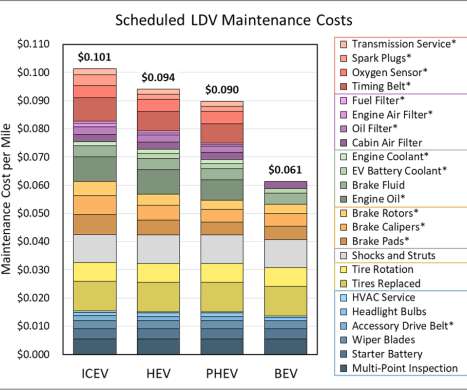
The study considers five different powertrains (internal combustion engine, hybrid-electric, plug-in hybrid-electric, fuel-cell-electric, and battery-electric) and 12 cost components (purchase cost, depreciation, financing, fuel, insurance, maintenance, repair, taxes, registration fees, tolls and parking, payload capacity and labor).

article thumbnail

Oil sands GHG lifecycle study using operating data finds lower emitting oil sands cases outperform higher emitting conventional crude cases; a call for more sophisticated tools and reporting

Green Car Congress

Well-to-wheel (WTW) greenhouse gas emissions for in situ SAGD and surface mining pathways generated employing GHOST/TIAX/ GHGenius combination and comparison with SAGD, mining and conventional crude oil literature pathways (all results are on a HHV basis). 74% of WTW emissions in our oil sands pathways. Click to enlarge.

Oil-Sands 287
article thumbnail

EPA trends report sees record levels of average new vehicle fuel economy and CO2 emissions for MY 2012; role of new gasoline vehicle technologies

Green Car Congress

EPA projects advanced transmissions (6+ speeds and CVTs), gasoline direct injection (GDI) systems, and turbocharged engines will be installed on at least 15% of all MY 2013 vehicles. The majority of the emissions and fuel savings from current vehicles, EPA noted, is due to new gasoline vehicle technologies. Click to enlarge.

article thumbnail

EEA report: EVs are better for climate and air quality

Green Car Congress

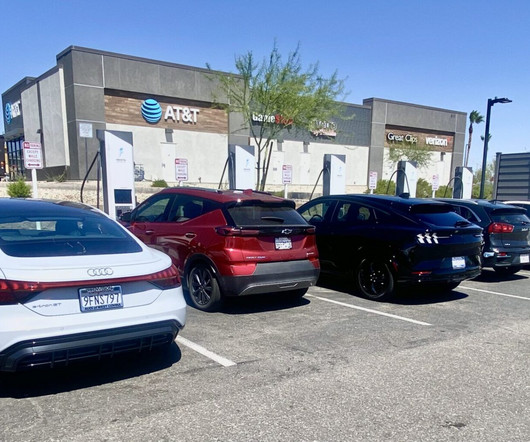
Battery electric cars emit less greenhouse gases and air pollutants over their entire life cycle than petrol and diesel cars, according to a European Environment Agency (EEA) report. Emissions are usually higher in the production phase of electric cars, but these are more than offset by lower emissions in the use phase over time.

Climate 268