Remove 2010 Remove Coal Remove Information Remove Wind
article thumbnail

US wind generation fell in 2023 for the first time since the 1990s

Baua Electric

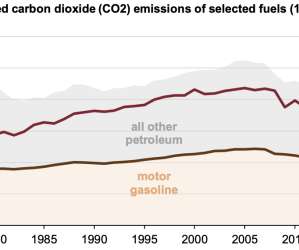
Annual US power generation from wind turbines declined in 2023 for the first time since the mid-1990s – here’s why. gigawatts (GW) of new wind capacity last year, but data from the US Energy Information Administration’s “ Power Plant Operations Report ” show that US wind generation in 2023 totaled 425,235 gigawatt-hours (GWh) – 2.1%

Wind 52
article thumbnail

EIA: US energy-related CO2 fell by 2.8% in 2019, slightly below 2017 levels

Green Car Congress

in 2019 to 5,130 million metric tons (MMmt), according to data in the US Energy Information Administration’s (EIA) Monthly Energy Review. CO 2 emissions from coal fell by 14.6%, the largest annual percentage drop in any fuel’s CO 2 emissions in EIA’s annual CO 2 data series dating back to 1973. CO 2 emissions had increased by 2.9%

2019 273
article thumbnail

EIA: world energy consumption to grow 56% 2010-2040, CO2 up 46%; use of liquid fuels in transportation up 38%

Green Car Congress

World energy consumption by fuel type, 2010-2040. The US Energy Information Administration’s (EIA’s) International Energy Outlook 2013 (IEO2013) projects that world energy consumption will grow by 56% between 2010 and 2040, from 524 quadrillion British thermal units (Btu) to 820 quadrillion Btu. Source: IEO2013.

2010 317
article thumbnail

EIA: US electricity generation from coal and natural gas both increased with summer heat

Green Car Congress

In August 2012, coal produced 39% of US electricity, up from a low of 32% in April 2012, when the natural gas share of generation equaled that of coal. The August coal share of generation is still notably lower than the 50% annual average over the 1990-2010 period. Other plants use PRB coal transported by rail.

Coal 236
article thumbnail

EIA reports a 3.9% increase in US energy-related carbon dioxide emissions in 2010

Green Car Congress

Factors contributing to the growth in energy-related CO 2 emissions in 2010. US carbon dioxide emissions from the consumption of fossil fuels were 5,638 million metric tons carbon dioxide (MMTCO 2 ) in 2010, an increase of 3.9% Consumption of coal, the most carbon-intensive fossil fuel, rose by 6% in 2010 after falling by 12% in 2009.

2010 268
article thumbnail

Americans Using Less Energy Overall and Using More Renewable Energy Resources

Green Car Congress

The United States used significantly less coal and petroleum in 2009 than in 2008, and significantly more wind power. The information is based on DOE/EIA-0384(2009), August 2010. hydro, wind and solar) in BTU-equivalent values by assuming a typical fossil fuel plant heat rate." 22,09, 2.16 88 quads, respectively.

Energy 294
article thumbnail

EPRI assesses status of 8 key power generation technologies for US; estimates of capital cost and levelized cost of electricity

Green Car Congress

Representative costs are reported in constant December 2010 US dollars. impacts on existing generating plants from pending or anticipated environmental rules on emissions, use of water resources, and coal ash handling and disposal. The analysis is based on 2010 EPRI research results and updates a November 2009 assessment.

EPRI 239