article thumbnail

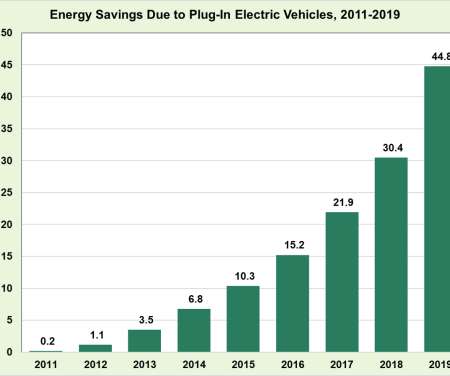
ANL estimates US energy savings due to light-duty PEV use at 44.8T Btu in 2019, up 47% from 2018

Green Car Congress

In a recent report assessing multiple properties of plug-ion electric vehicles (PEVs) solid in the US, a team from Argonne National Laboratory (ANL) estimates that the energy savings in the United States due to light-duty PEVs in 2019 was 44.8 Gasoline conversion to Btu using gross heating value 125,000 Btu/gallon. More than 1.4

2019 221
article thumbnail

Argonne report on characteristics of light-duty plug-in electric vehicles in US

Green Car Congress

A new report from a team at Argonne National Laboratory examines the changing characteristics for light-duty plug-in electric vehicles (PEVs) from 2010-2021, evaluating range, energy efficiency, costs, and performance. terawatt-hours of electricity to drive 19.1 billion miles, offsetting 700 million gallons of gasoline.

Plug-in 284
article thumbnail

EIA: US energy-related CO2 fell by 2.8% in 2019, slightly below 2017 levels

Green Car Congress

US energy-related CO 2 emissions declined by 2.8% in 2019 to 5,130 million metric tons (MMmt), according to data in the US Energy Information Administration’s (EIA) Monthly Energy Review. The changes in US energy-related CO 2 emissions in 2019 offset the increase in 2018. Total net electricity generation fell by 1.5%

2019 273
article thumbnail

ARPA-E Battery/Storage Exposition 14 Jan

Green Car Congress

The US Department of Energy’s (DOE’s) Advanced Research Projects Agency - Energy (ARPA-E) is hosting a pitch event, ARPA-E’s Battery/Storage Exposition, on 14 January 2021, from 1:00-3:00 pm EST. This event will feature pitches from a select group of ARPA-E teams developing energy storage technologies.

Batteries 418
article thumbnail

Lawrence Livermore publishes state-by-state energy/water Sankey diagrams

Green Car Congress

For the first time, Lawrence Livermore National Laboratory (LLNL) has published state-by-state energy and water Sankey diagrams in one location so that analysts and policymakers can find all the information they need in one place. General location of energy and water categories. Energy and water generally “flows” from left to right.

Water 231
article thumbnail

ExxonMobil: global GDP up ~140% by 2040, but energy demand ~35% due to efficiency; LDV energy demand to rise only slightly despite doubling parc

Green Car Congress

As the world population increases by the estimated 30% from 2010 to 2040, ExxonMobil sees global GDP rising by about 140%, but energy demand by only about 35% due to greater efficiency. Even as demand increases, the world will continue to become more efficient in its energy use, according to the 2015 Outlook for Energy: A View to 2040.

Energy 252
article thumbnail

Stock-flow modeling suggests energy transition within transportation will take several decades

Green Car Congress

Institute of Transport Economics (TØI) has calculated the energy transition time lag for motor vehicles under a number of scenarios. The four different scenarios differ in terms of new vehicle acquisitions, but are identical in terms of transition rates—set in accordance with the average observed annual rates during 2010–2015.