Remove 2005 Remove Climate Change Remove Gas-Electric Remove Gasoline-Electric
article thumbnail

EPA GHG Inventory shows US GHG down 1.7% y-o-y in 2019, down 13% from 2005

Green Car Congress

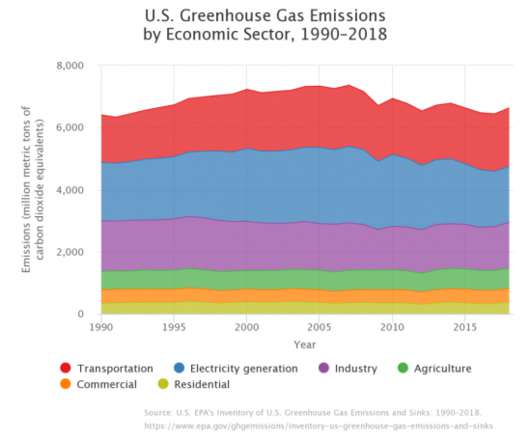
The US Environmental Protection Agency (EPA) released its 28 th annual Inventory of US Greenhouse Gas Emissions and Sinks (GHG Inventory), which presents a national-level overview of annual greenhouse gas emissions from 1990 to 2019. CO 2 emissions decreased 2.2% from 2018 to 2019. Total GHG emissions in 2019 were up 1.8% Source: EPA.

2005 418
article thumbnail

EPA: US greenhouse gases dropped 3.4% in 2012 from 2011; down 10% from 2005 levels

Green Car Congress

US greenhouse gas emissions by gas. The US Environmental Protection Agency (EPA) released its 19 th annual report of overall US greenhouse gas (GHG) emissions, showing a 3.4% Annual US greenhouse gas emissions relative to 1990 (1990=0). Source: EPA. Click to enlarge. decrease in 2012 from 2011. The Inventory of U.S.

2005 252
article thumbnail

National Academies Report Examines Hidden Cost of Energy Production and Use in US; Estimates $120B in 2005

Green Car Congress

Health and other non-climate damages by life-cycle component for different combinations of fuels and light-duty automobiles in 2005 (top) and 2030 (bottom). GHG emissions (grams CO 2 -eq)/VMT by life-cycle component for different combinations of fuels and light-duty automobiles in 2005 (top) and 2030 (bottom). Click to enlarge.

2005 246
article thumbnail

EPA annual inventory shows US GHG up 3.1% from 2017-2018

Green Car Congress

The 2020 edition of US Environmental Protection Agency’s (EPA) comprehensive annual report on nationwide greenhouse gas (GHG) emissions shows that emissions increased from 2017 to 2018 by 3.1% (after accounting for sequestration from the land sector). Source: EPA. >. through the uptake of carbon and storage in forests, vegetation and soils.

2018 243
article thumbnail

EPA: US GHG fell 0.5% y-o-y in 2017; power sector down by 4.2%, transportation up 1.21%

Green Car Congress

Year-over-year, US greenhouse gas emissions were 0.5% lower in 2017 than the prior year (after accounting for sequestration from the land sector), and power sector emissions fell 4.2%, according to the 2019 edition of the US Environmental Protection Agency’s (EPA) annual report on greenhouse gas (GHG) emissions.

2017 199
article thumbnail

Global Carbon Project: Global carbon emissions growth slows, but hits record high

Green Car Congress

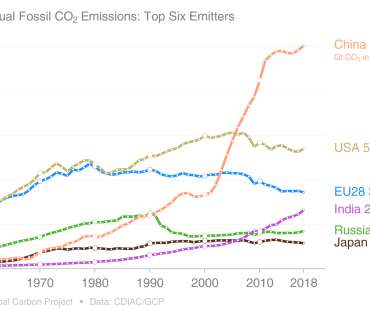
Driven by rising natural gas and oil consumption, levels of CO 2 are expected to hit 37 billion metric tons this year, according to new estimates from the Global Carbon Project (GCP), an initiative led by Stanford University scientist Rob Jackson. Because of greater supply and cheaper prices, natural gas usage has surged, with an attendant 2.6%

Carbon 195
article thumbnail

EPA: US GHG emissions in 2017 down 0.3% from 2016

Green Car Congress

greenhouse gas emissions were 6,472.3 from 2016, according to the US Environmental Protection Agency’s (EPA’s) latest Greenhouse Gas Inventory. The decrease in total greenhouse gas emissions between 2016 and 2017 was driven in part by a decrease in CO 2 emissions from fossil fuel combustion. below 2005 levels.

2017 262