Remove 2005 Remove Climate Change Remove Economy Remove EPA
article thumbnail

EPA GHG Inventory shows US GHG down 1.7% y-o-y in 2019, down 13% from 2005

Green Car Congress

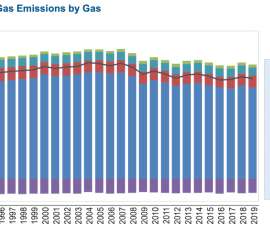
The US Environmental Protection Agency (EPA) released its 28 th annual Inventory of US Greenhouse Gas Emissions and Sinks (GHG Inventory), which presents a national-level overview of annual greenhouse gas emissions from 1990 to 2019. Source: EPA. Source; EPA. Total GHG emissions in 2019 were up 1.8% over the same period.

2005 418
article thumbnail

EPA: US GHG emissions up 6% in 2021 from 2020

Green Car Congress

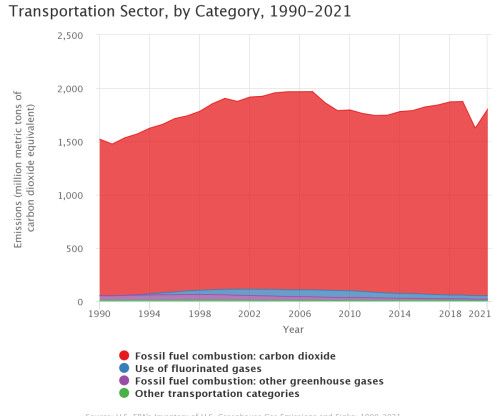
The US Environmental Protection Agency (EPA) released its 30 th annual Inventory of US Greenhouse Gas Emissions and Sinks (GHG Inventory), which presents a national-level overview of annual greenhouse gas emissions from 1990 to 2021. Source: EPA. Fuel economy of light-duty vehicles is another important factor. from 2020 to 2021.

EPA 259
article thumbnail

Biden sets 2030 net GHG reduction target for US of 50-52% below 2005 levels

Green Car Congress

US President Joe Biden announced a new target for the United States to achieve a 50-52% reduction from 2005 levels in economy-wide net greenhouse gas (GHG) emissions in 2030. Source: EPA “Inventory of US Greenhouse Gas Emissions and Sinks”. or 5,769 MMT CO 2 Eq. after accounting for sequestration from the land sector.

2005 243
article thumbnail

EPA: US greenhouse gases dropped 3.4% in 2012 from 2011; down 10% from 2005 levels

Green Car Congress

Source: EPA. The US Environmental Protection Agency (EPA) released its 19 th annual report of overall US greenhouse gas (GHG) emissions, showing a 3.4% According to the report, GHG emissions in 2012 showed a 10% drop below 2005 levels, and were only slightly above the emissions in 1994 (6,520 million metric tons). Source: EPA.

2005 252
article thumbnail

EPA annual inventory shows US GHG up 3.1% from 2017-2018

Green Car Congress

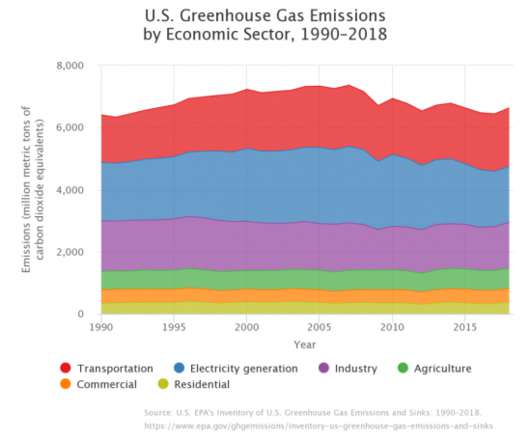
The 2020 edition of US Environmental Protection Agency’s (EPA) comprehensive annual report on nationwide greenhouse gas (GHG) emissions shows that emissions increased from 2017 to 2018 by 3.1% (after accounting for sequestration from the land sector). Source: EPA. >.

2018 243
article thumbnail

EPA: US GHG fell 0.5% y-o-y in 2017; power sector down by 4.2%, transportation up 1.21%

Green Car Congress

lower in 2017 than the prior year (after accounting for sequestration from the land sector), and power sector emissions fell 4.2%, according to the 2019 edition of the US Environmental Protection Agency’s (EPA) annual report on greenhouse gas (GHG) emissions. Year-over-year, US greenhouse gas emissions were 0.5%

2017 199
article thumbnail

EPA: US greenhouse gases up 2% in 2013; increased coal consumption, cool winter

Green Car Congress

Source: EPA. over the prior year, according to the EPA’s newly published Inventory of US Greenhouse Gas Emissions and Sinks: 1990–2013. Source: EPA. Starting in 2005, the rate of VMT growth slowed considerably (and declined rapidly in 2008) while average new vehicle fuel economy began to increase. Click to enlarge.

2013 150