article thumbnail

TOAR shows present-day global ozone distribution and trends relevant to health; public database

Green Car Congress

Ozone levels across much of North America and Europe dropped significantly between 2000 and 2014. People living in parts of southern Europe, South Korea and southern Japan and China also experienced more than 15 days a year of ozone levels above 70 ppb. Source: University of Leicester. Click to enlarge.

Ozone 255
article thumbnail

EPA proposes approval of new ozone plans for the two of the worst Air Quality Zones in US: California’s San Joaquin Valley and South Coast

Green Car Congress

US EPA Region 9 8-hour ozone trends, 1979-2000. These State Implementation Plans (SIPs) are the roadmaps to meeting the 1997 8-hour ozone National Ambient Air Quality Standards (NAAQS) of 0.08 In 1997, EPA first established the 8-hour ozone standard, which replaced the older 1-hour ozone standard (0.12 Source: EPA.

Ozone 236
article thumbnail

Reducing Black Carbon Emissions and Ground-Level Ozone Would Provide Immediate Benefit Against Climate Change

Green Car Congress

Reducing emissions of black carbon soot and ground-level ozone would quickly make a considerable dent in the climate change problem and would also contribute to public health and protect crop yields, according to an essay in the September/October issue of Foreign Affairs. Besides a danger to breathe, ozone lowers crop yields.

article thumbnail

MIT study says combustion emissions cause ~200,000 premature deaths/year in US; vehicles and power generation top sources

Green Car Congress

emissions from combustion sources such as industrial smokestacks, vehicle tailpipes, marine and rail operations, and commercial and residential heating throughout the United States cause about 200,000 (90% CI: 90,000–362,000) premature deaths each year, with another 10,000 (90% CI: ?1,000 900 to 11,000) ozone-related early deaths per year.

MIT 378
article thumbnail

PSI team develops web tool for consumers to compare environmental impact of passenger cars in detail

Green Car Congress

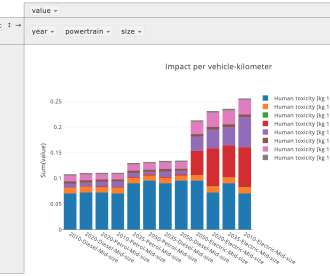
The program determines the environmental balance of vehicles with different size classes and powertrains, and presents the results in comparative graphics. The entire life cycle of the passenger cars is taken into account, including the manufacture of the vehicles and the environmentally relevant emissions from driving. in review).

Mariner 435
article thumbnail

Latest GHG Inventory shows California remains below 2020 emissions target; much steeper rate of GHG reductions required

Green Car Congress

in 2018 (2000-2018 average year-over-year increase is 6.8%), continuing the increasing trend as they replace Ozone Depleting Substances (ODS) being phased out under the 1987 Montreal Protocol. These programs cover transportation fuels, industrial emissions, vehicle emissions and emissions from electricity generation.

2020 221
article thumbnail

California 2017 GHG inventory shows 1.2% total drop from 2016; transportation sector emissions up 1%

Green Car Congress

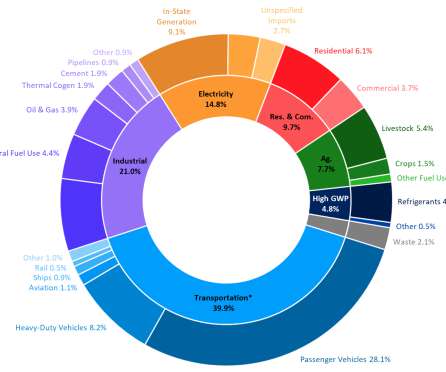
Changes in emissions by Scoping Plan sector between 2000 and 2017. Transportation sector emission sources include combustion of fuels utilized in-state that are used by on-road and off-road vehicles, aviation, rail, and water-borne vehicles, as well as a few other smaller sources. Compared to 2016, California’s GDP grew 3.6%

2017 230