Remove 2018 Remove Global Remove Ozone Remove Parts
article thumbnail

TOAR shows present-day global ozone distribution and trends relevant to health; public database

Green Car Congress

Ozone levels across much of North America and Europe dropped significantly between 2000 and 2014. People living in parts of southern Europe, South Korea and southern Japan and China also experienced more than 15 days a year of ozone levels above 70 ppb. Source: University of Leicester. Click to enlarge.

Ozone 255
article thumbnail

Study: ozone levels higher across China than in other countries tracking the air pollutant

Green Car Congress

In China, people breathe ozone-laden air two to six times more often than people in the United States, Europe, Japan, or South Korea, according to a new international study published in Environmental Science & Technology Letters. 2017 for one ozone metric. The inset shows ozone trends in Beijing (red) and Los Angeles (blue).

Ozone 199
article thumbnail

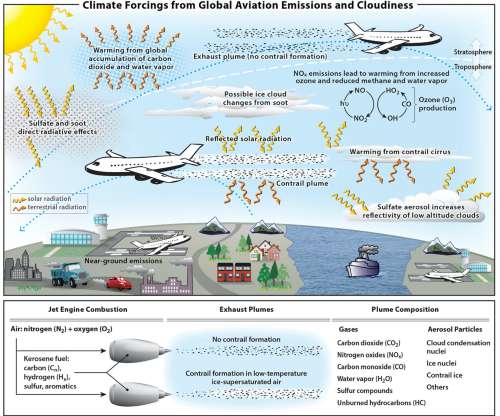
Study: 2/3 of aviation climate impact due to emissions other than CO2

Green Car Congress

In the new study, we have analyzed 20 years of aviation emissions, up until and including 2018. Net warming from NO x emissions is a sum over warming (short-term ozone increase) and cooling (decreases in methane and stratospheric water vapor, and a long-term decrease in ozone) terms. For 2018 the net aviation ERF is +100.9

Climate 448
article thumbnail

Duke/York study finds long-term exposure to ozone has significant impacts on human health, but lower than prior modeling results

Green Car Congress

A team from Duke University in the US and University of York in the UK have utilized a novel method to estimate long-term ozone exposure and previously reported epidemiological results to quantify the health burden from long-term ozone exposure in three major regions of the world. —Karl Seltzer. Karl M Seltzer et al.

Ozone 207
article thumbnail

Latest GHG Inventory shows California remains below 2020 emissions target; much steeper rate of GHG reductions required

Green Car Congress

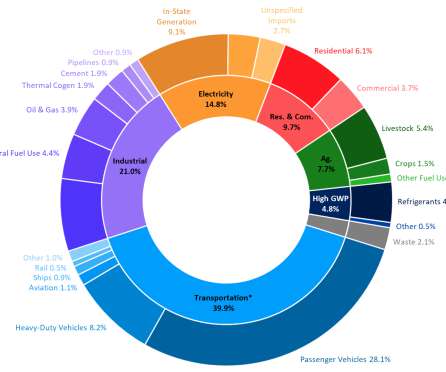
The California Air Resources Board released GHG emissions data for 2018 showing that emissions remain below 1990 levels but are effectively flat compared to 2017, while the economy grew by 4.3%. Total statewide 2018 GHG emissions were 425.3 million metric tons between 2017 and 2018, the first such decline since 2013.

2020 221
article thumbnail

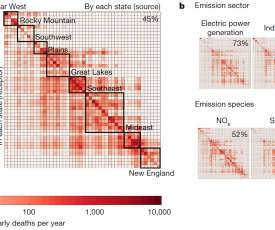
MIT study: half of US deaths related to air pollution are linked to out-of-state emissions

Green Car Congress

The study focuses on the period between 2005 and 2018 and tracks combustion emissions of various polluting compounds from various sectors, looking at every state in the contiguous United States, from season to season and year to year. They first obtained emissions data from each of seven sectors for the years 2005, 2011, and 2018.

MIT 307
article thumbnail

EPA, NHTSA issue One National Program Rule; EPA withdraws CA waiver for GHG and fuel economy

Green Car Congress

The action finalizes parts of the SAFE Vehicles Rule that was first proposed on 2 August 2018. For its part, EPA is withdrawing the Clean Air Act preemption waiver it granted to the State of California in January 2013 as it relates to California’s GHG and ZEV programs. Earlier post.)