Remove 2005 Remove Coal Remove Gasoline-Electric Remove Motor
article thumbnail

EPA: US greenhouse gases dropped 3.4% in 2012 from 2011; down 10% from 2005 levels

Green Car Congress

According to the report, GHG emissions in 2012 showed a 10% drop below 2005 levels, and were only slightly above the emissions in 1994 (6,520 million metric tons). CO 2 emissions are produced by the electricity generation sector as they consume fossil fuel to provide electricity to one of the other four end-use sectors.

2005 252
article thumbnail

EPA: US GHG emissions in 2017 down 0.3% from 2016

Green Car Congress

The decrease in CO 2 emissions from fossil fuel combustion was a result of multiple factors, including a continued shift from coal to natural gas, increased use of renewables in the electric power sector, and milder weather that contributed to less overall electricity use. below 2005 levels. above 1990 levels in 2007.

2017 262
article thumbnail

EPA: US GHG fell 0.5% y-o-y in 2017; power sector down by 4.2%, transportation up 1.21%

Green Car Congress

This decrease was largely driven by a decrease in emissions from fossil fuel combustion, which was a result of multiple factors including a continued shift from coal to natural gas and increased use of renewables in the electric power sector, and milder weather that contributed to less overall electricity use.

2017 199
article thumbnail

EIA: US energy-related CO2 emissions down 1.7% in 2016; carbon intensity of economy down 3.1%; transportation emissions up

Green Car Congress

Emissions have declined in 6 out of the past 10 years, and energy‐related CO 2 emissions in 2016 were 823 MMmt (14%) below 2005 levels, according to the EIA. Among the findings of the EIA analysis: CO 2 emissions form natural gas surpassed those from coal in 2016. Transportation increase led by gasoline consumption.

2016 150
article thumbnail

Global Carbon Project: Global carbon emissions growth slows, but hits record high

Green Car Congress

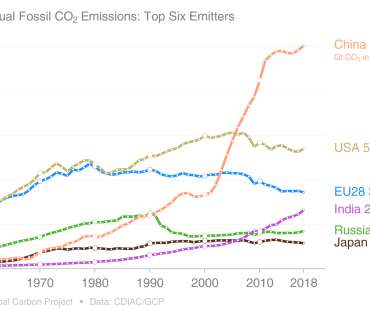
The decline of coal use in the European Union and United States is overshadowed by surging natural gas and oil use around the world, according to the researchers. About 40% of global carbon dioxide emissions were attributable to coal use, 34% from oil, 20% from natural gas, and the remaining 6% from cement production and other sources.

Carbon 195
article thumbnail

EIA Energy Outlook 2013 reference case sees drop in fossil fuel consumption as use of petroleum-based liquid fuels falls; projects 20% higher sales of hybrids and PHEVs than AEO2012

Green Car Congress

Transportation sector gasoline demand declines. Sales of battery-powered electric vehicles are 65% lower in the AEO2013 Reference case than the year before, with annual sales in 2035 estimated to be about 119,000. Motor gasoline consumption will be less than previously estimated. Click to enlarge. Overall findings.

Fuel 225
article thumbnail

Berkeley Lab study forecasts China energy use will peak within 20 years; 356 million private cars by 2050

Green Car Congress

In the years since 2005, we have established and significantly enhanced the LBNL China End-Use Energy Model based on the level of diffusion of end use technologies and other drivers of energy demand. It is reduced by 900 Mtce to 4600 Mtce in AIS in 2050, a cumulative energy reduction of 26 billion tonnes of coal equivalent from 2005 to 2050.

China 285