Remove 2000 Remove Gas Remove Global Remove Ozone
article thumbnail

TOAR shows present-day global ozone distribution and trends relevant to health; public database

Green Car Congress

Ozone levels across much of North America and Europe dropped significantly between 2000 and 2014. People living in parts of southern Europe, South Korea and southern Japan and China also experienced more than 15 days a year of ozone levels above 70 ppb. Source: University of Leicester. Click to enlarge.

Ozone 255
article thumbnail

Study finds rising temperatures increase risk of unhealthy ozone levels absent sharp cuts in precursors

Green Car Congress

Ozone pollution across the continental United States will become far more difficult to keep in check as temperatures rise, according to new work led by the National Center for Atmospheric Research (NCAR). Preliminary global mean CO 2 concentrations in February 2014 were 398.06 Ozone formation. Scenario A2 and RCP 8.5.

Ozone 199
article thumbnail

Reducing Black Carbon Emissions and Ground-Level Ozone Would Provide Immediate Benefit Against Climate Change

Green Car Congress

Reducing emissions of black carbon soot and ground-level ozone would quickly make a considerable dent in the climate change problem and would also contribute to public health and protect crop yields, according to an essay in the September/October issue of Foreign Affairs. Besides a danger to breathe, ozone lowers crop yields.

article thumbnail

Latest GHG Inventory shows California remains below 2020 emissions target; much steeper rate of GHG reductions required

Green Car Congress

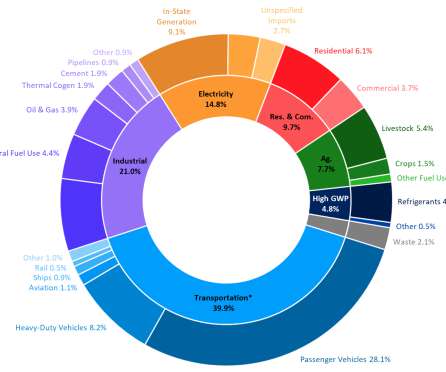
California’s latest greenhouse gas data shows that while the state continues to stay below its 2020 target for emissions, there is much more work to do to achieve carbon neutrality by 2045. Per capita GHG emissions in California have dropped from a 2001 peak of 14.0 tons per person to 10.7 tons per person in 2018, a 24% decrease.

2020 221
article thumbnail

California 2017 GHG inventory shows 1.2% total drop from 2016; transportation sector emissions up 1%

Green Car Congress

The California Air Resources Board’s latest state inventory of greenhouse gas emissions shows that California’s GHG emissions continue to decrease. Changes in emissions by Scoping Plan sector between 2000 and 2017. Compared to 2016, California’s GDP grew 3.6% while the carbon intensity of its economy declined by 4.5%. Source: ARB.

2017 230
article thumbnail

IPCC: GHG emissions accelerating despite mitigation efforts; major institutional and technological change required to keep the heat down

Green Car Congress

Decomposition of the decadal change in total global CO 2 emissions from fossil fuel combustion by four driving factors; population, income (GDP) per capita, energy intensity of GDP and carbon intensity of energy. giga tonne carbon dioxide equivalent (GtCO 2 eq) (2.2%) per year from 2000 to 2010 compared to 0.4 Click to enlarge.

Emissions 257
article thumbnail

California Air Resources Board posts revised draft of strategy to reduce “Super Pollutants”

Green Car Congress

SLCPs are a category of pollutants which remain in the atmosphere for a relatively brief period, but have global warming potentials that are much higher than those of CO 2. SLCPs may account for an estimated 40% of global warming, increasing the impacts of climate change. CO 2 remains in the atmosphere for up to a century.

Pollution 150