When we talk about the environmental benefits of electric vehicles (EVs), we get a lot of questions about the lifetime greenhouse gas (GHG) impact of EVs vs internal combustion engine (ICE) cars. Electric cars don’t have tailpipe emissions when running on electricity, but battery manufacturing is an energy-intensive process. So how does the math work out? According to this report from the Union of Concerned Scientists (UCS), EVs have far fewer global warming emissions over their lifetime than ICE cars. In this blog, we'll break down the research from UCS and explain how EVs are cleaner and produce less total GHG emissions.
EVs Cut Lifecycle Emissions by More Than Half
In its report, UCS compares the total global warming emissions of gas cars, electric cars, gas trucks, and electric trucks, and finds that in all cases, the electric version cuts lifetime greenhouse gas emissions by more than half. The numbers mentioned below are based on a national average of emissions from electricity generation, which is much higher than the emissions profile in Massachusetts and Rhode Island (more on that below).
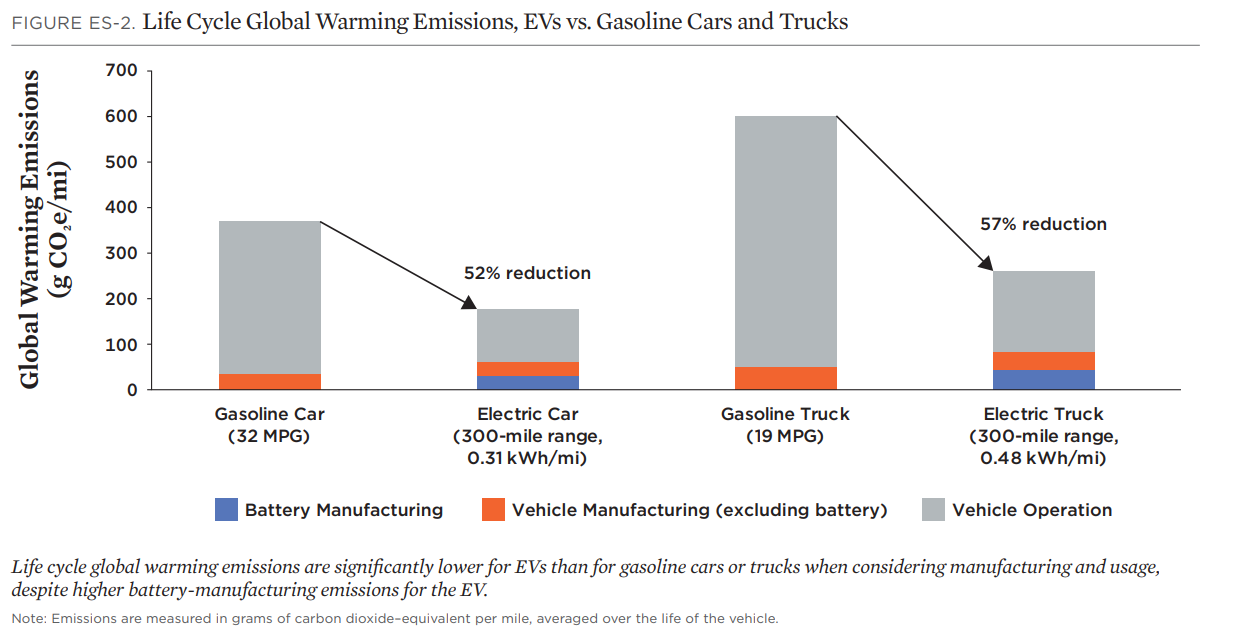
Source: Union of Concerned Scientists
As you can see from this graph, vehicle manufacturing (the orange bar) produces the same amount of global warming emissions for both cars and trucks. While electric vehicles have an extra category because of battery manufacturing (the bar in blue), these initial emissions-intensive processes pay off when you look at the life cycle global warming emissions of ICE cars. Vehicle operation accounts for most of the lifetime emissions for both gas and electric vehicles, but since electric vehicles run SO much cleaner than gas cars, the overall emissions are lower.
Over their lifetime, electric cars produce 52% less GHG emissions than gas cars, and electric trucks produce 57% less than gas trucks. (If you are wondering why the emissions of vehicle operation are lower, check out this page here.)
Break-Even Point in Emissions
Another way to look at total emissions is by the “break-even point.” In this case, a break-even point is when an electric vehicle makes up for the emissions produced during its manufacturing stage in its consumption stage. Essentially, how long or how much does an electric vehicle need to be driven to match the ‘emissions debt’ it produced in its manufacturing stage? According to the graph below, an electric car and electric truck would need to drive 21,300 miles and 17,500 miles respectively to reach the break-even points with their gas counterparts. Considering most vehicles are driven 200,000 miles in their lifetime, that means the break-even point arrives after 1.5-2 years of driving. But again, this is predicated on the national average of vehicles TODAY.
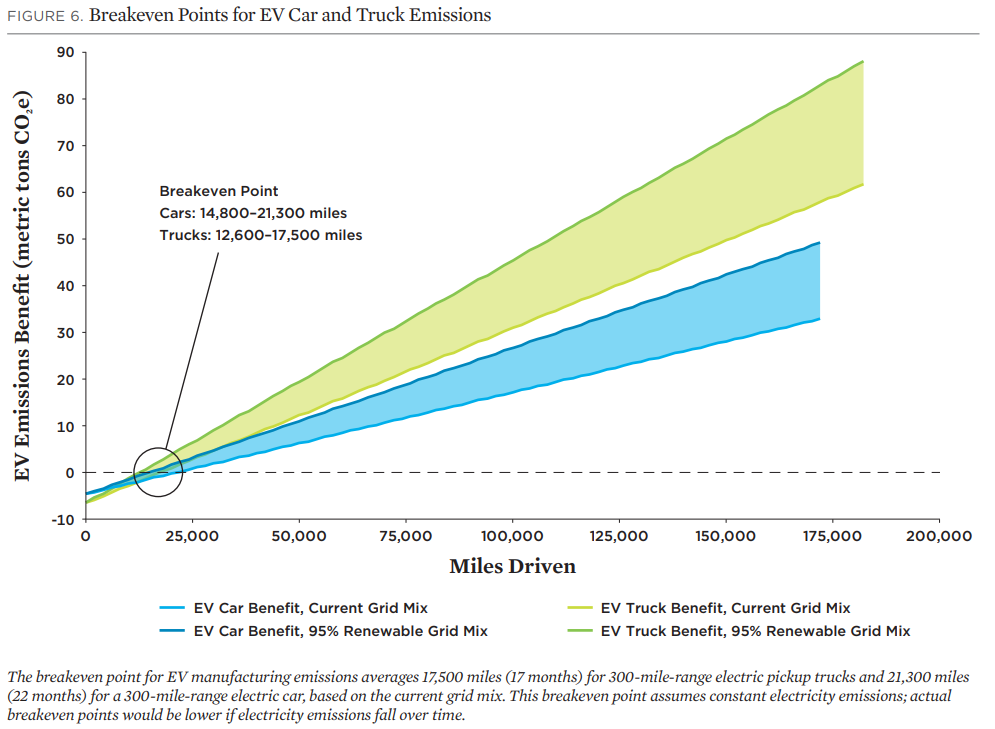
Source: Union of Concerned Scientists
The best news is our electricity grid gets cleaner as we add more renewable energy with every passing year. That means the break-even point will decrease gradually. When we reach a point at which our electricity grid is 95% renewable, electric cars and trucks would only need 14,800 and 12,600 miles respectively to reach their break-even point.
Our States Are Already Greener
The comparative emissions and break-even point were calculated using a national average. But the electricity we consume here in Massachusetts and Rhode Island is cleaner than the national average, which means the emissions pay-back period is even shorter. Our states have standards requiring electricity suppliers to incorporate more renewable energy every year. Check out this blog that further discusses MA and RI requirements. Rhode Island is going to reach 100% renewable energy by 2033, and we’ll be pushing for Massachusetts to follow suit so that date is coming faster than you might think!
And We Can Accelerate Progress
There are several reasons the lifecycle emissions of EVs can and will come down faster in the coming years.
- The Inflation Reduction Act will accelerate the adoption of renewable energy nationally, which will bring down manufacturing emissions and ongoing emissions. Again, the UCS graph above shows how EVs compare to gasoline-powered cars given today’s electricity mix on a national average. However, several analyses have been conducted on the impact of the federal Inflation Reduction Act on emissions from electricity. It is expected that IRA’s tax credits and other incentives will cause enough clean power to replace fossil fuels to reduce emissions nationally by 60-80 percent, so the breakeven point can come even faster.
- In the meantime, we are working with communities in Massachusetts and Rhode Island on Green Municipal Aggregation. This helps consumers lower their electricity bills and allows them to increase renewables in their electricity mix. By increasing more renewable energy on the grid and decreasing our fossil fuel consumption, the break-even point will be shorter for electric vehicles in these communities.
Conclusion
We’re hoping that with these new policy changes, consumers can confidently make their change to electric vehicles soon.
We are excited for the grid to get cleaner so that electric vehicles will increasingly get greener. If you’re looking to make your next car electric, sign our pledge, or if you’re looking to buy an EV, use our shopping tool to make the switch.
Comments