
Tesla Sales Shatter Wall Street Expectations — 9 Charts
Tesla has released its second-quarter production and sales numbers. The take-home summary: they crushed Wall Street’s expectations. I’ll just focus on deliveries (aka sales) here, but here’s a screenshot from Tesla’s press release showing both production and sales:

We wrote about expectations for Tesla sales a couple of times in the past week. In one article, I focused on Troy Teslike’s estimate that there would be 441,000 sales, but also mentioned the Wall Street consensus of 448,000 sales. In the headline, I added a little fudge room and put the range of expectations at 440,000–450,000. In a second article, Peter McGuthrie looked a little more broadly at Wall Street analyst expectations. At that point, the FactSet consensus was at about 445,000, but he also mentioned that Piper Sandler was forecasting 469,000 sales. Well, most of Wall Street was far off the mark, but Piper Sandler pretty much nailed it. Tesla soared above the consensus and delivered 466,140 vehicles in the second quarter. This was despite quarter-end inventory being up quite a bit in the United States.
Let’s look more closely at what this means for Tesla’s long-term sales trends.

This first and most basic chart shows Tesla’s quarterly sales from the beginning of Model S sales in 2012 through the second quarter of 2023. It shows that rather than slow down in the past quarter, the growth in deliveries was stronger than it had been in the first quarter. Also, it just clearly shows an almost perfectly continual rise in Tesla sales over the years. In fact, the growth in sales from Q1 2023 to Q2 2023 is similar to total sales in the second quarter of 2018, just 5 years ago.

This line graph then shows the model numbers Tesla shares in another quarterly visualization. Tesla combines Model 3 and Model Y sales (something almost all of us wish it would stop doing now that it’s a mature and successful company) and Model S and Model X sales (same). In any case, it shows a steep, steady rise in Model 3 plus Model Y sales, and a stagnant low level of sales from the much more expensive Model S and Model X.

Estimating a full split of those four models, I come up with the line graph above. In this case, Model 3 sales have been rising very mildly, while Model Y sales have dominated the company’s growth and continued to be quite sharp in recent quarters — though, they may be getting a little bit softer in their growth and tending toward a “leveling off” direction. Of course, this is just an estimate. We don’t have official company numbers in this case. Tesla Model 3 sales could be rising a bit more and Model Y sales could be leveling off more, or Model 3 sales may not be rising at all and Model Y sales may be rising more sharply. What we do know is that the Model Y was the best selling automobile model in the world in the first quarter, and, more likely than not, it was in the second quarter as well. (RIP, Toyota Corolla and Ford F-150.)

This next chart visualizes the same data as the line graph above it. It’s just another way to compare, visually, the model-specific growth. Additionally, since the sales totals are stacked, you can see the same pattern as that original bar chart showing total Tesla quarterly sales — it just starts a bit later in time, not extending all the way back to the first quarter of Model S sales in 2012.
For the next four charts, we’ll shift to cumulative sales, before returning to quarterly sales in a final, interactive chart or series of charts.

Starting with overall Tesla sales, we have this chart showing cumulative Tesla sales from quarter to quarter starting in the company’s first quarter of Model S sales. It’s almost a perfect chart demonstrating exponential growth — almost like a demonstrative chart in an economics textbook. Find me a better real-world chart demonstrating disruptive tech growth.

This next chart shows cumulative Model 3 and Model Y sales combined, but with the Model Y’s cumulative sales on top in the darker blue color.
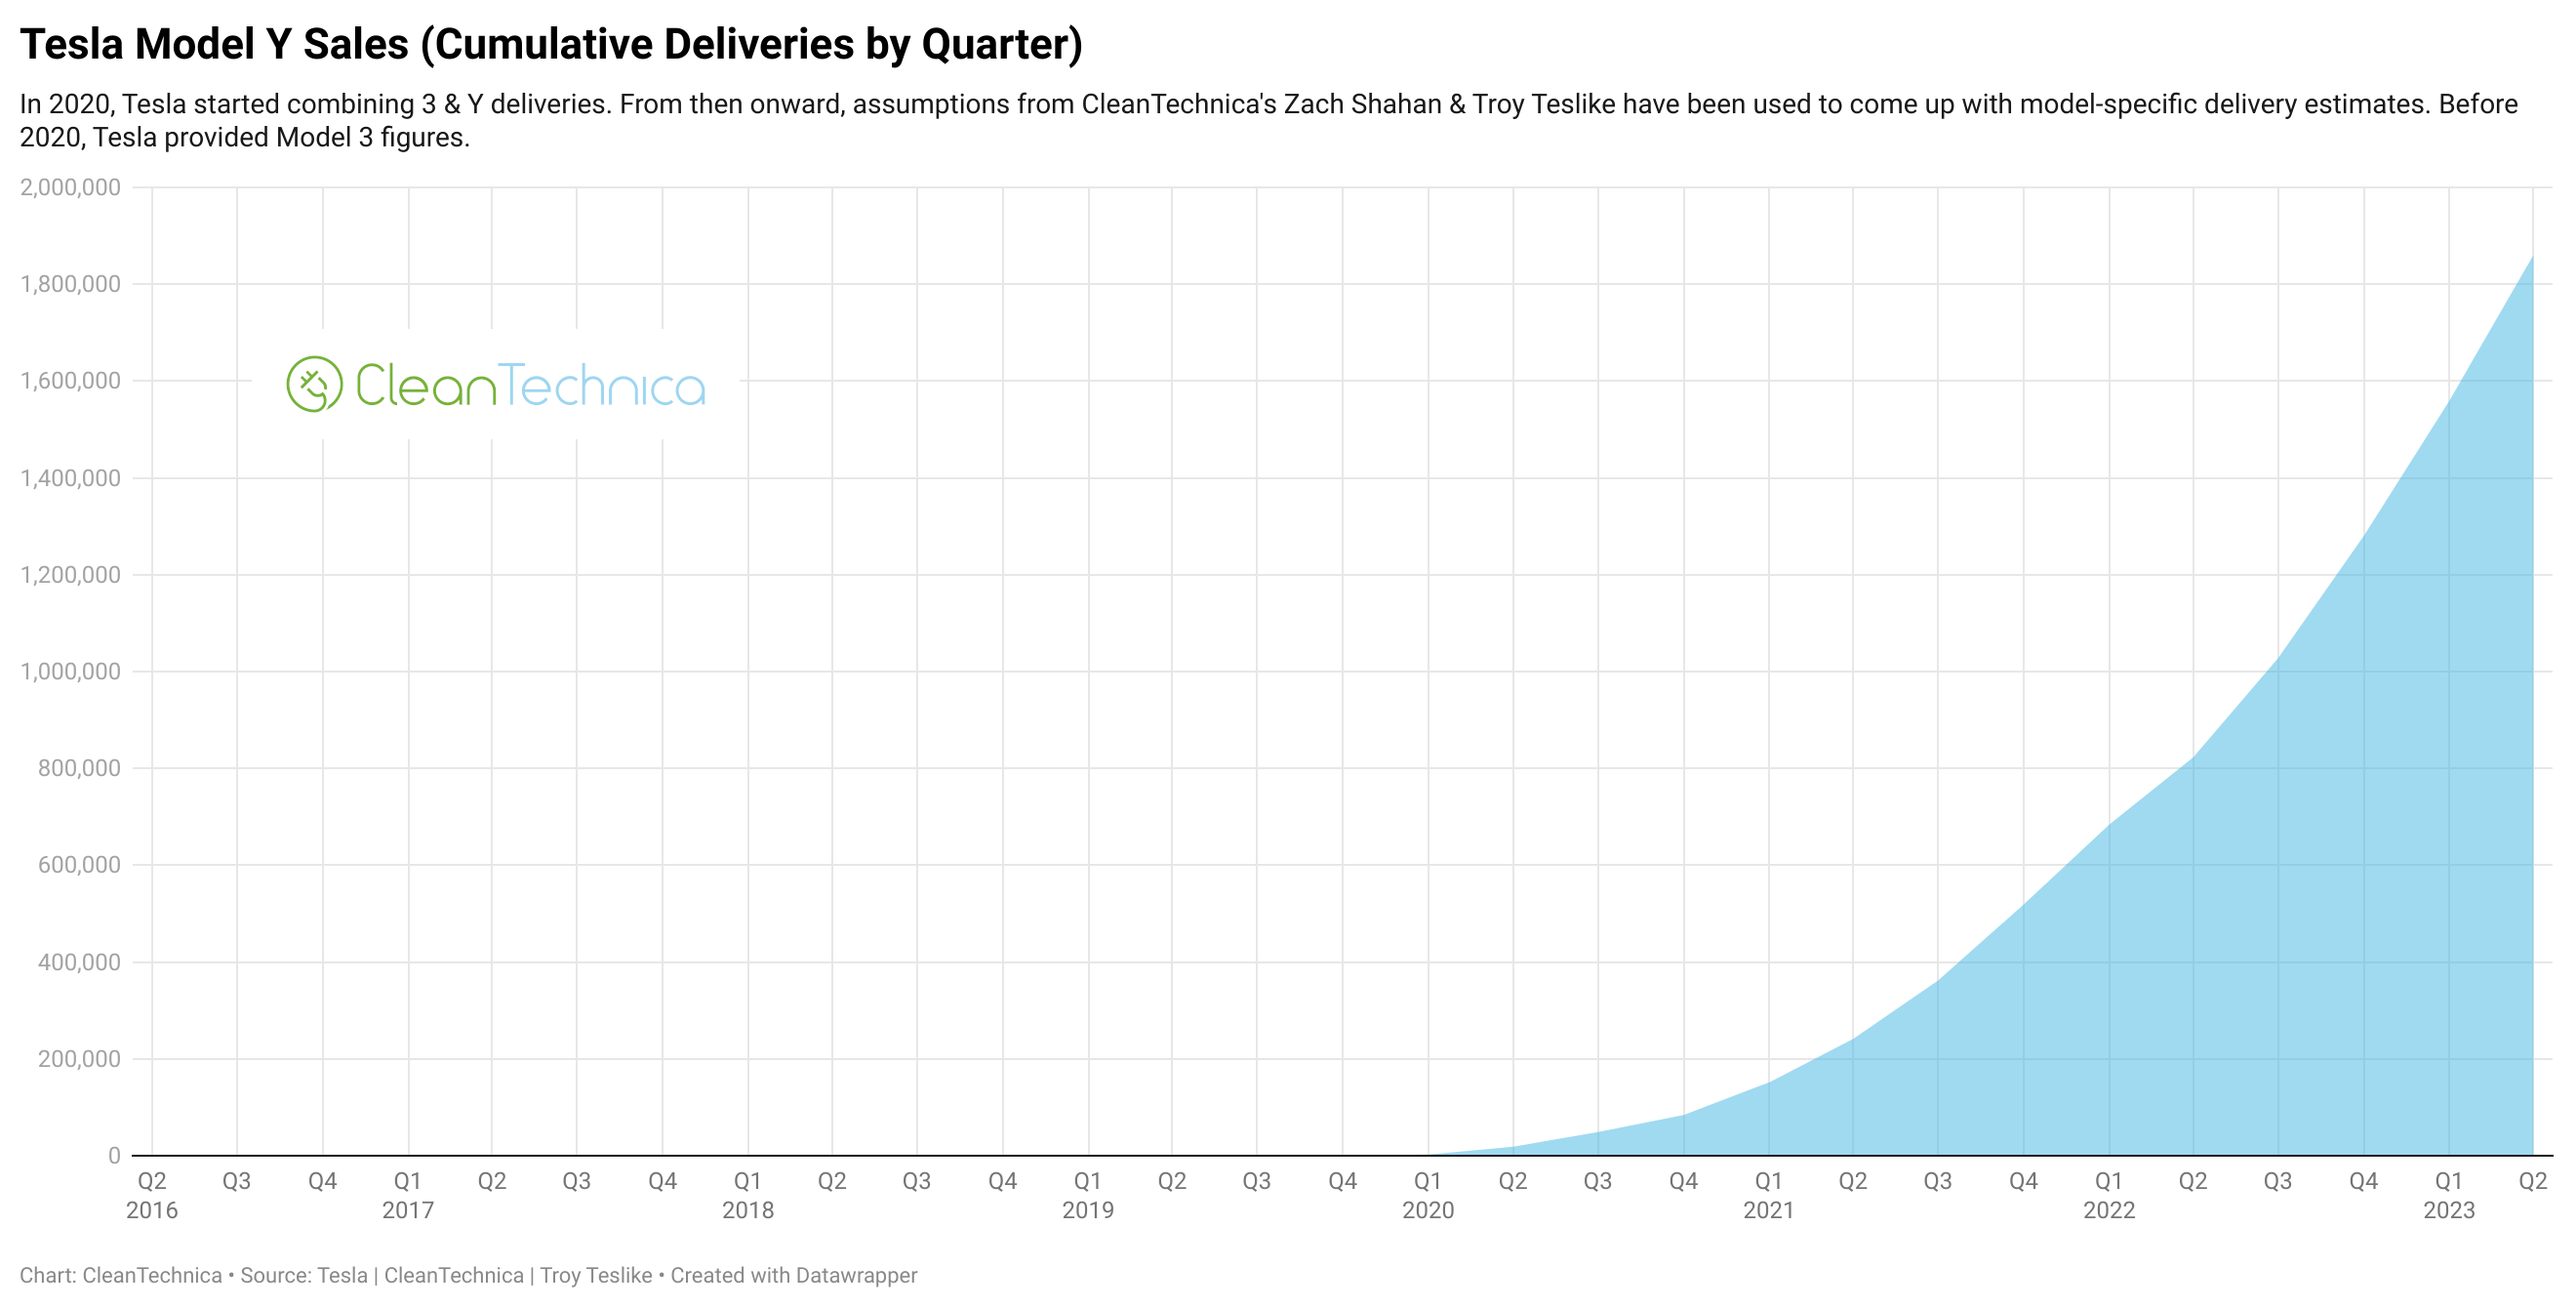
Here’s a look only at cumulative Model Y sales.

And here’s a look only at cumulative Model 3 sales.
Last but not least, I’ve got an interactive chart showing each model’s quarterly sales over time. You just have to click on the model’s name to see its quarterly sales chart. Below this interactive chart, there’s also an interactive version of the 4th chart from the top. Unfortunately, these interactive charts often aren’t visible or aren’t easy to use and see on mobile devices. So, to get full enjoyment (or perhaps any enjoyment) out of these interactive sales charts, jump onto a normal computer if you are simply on a phone right now.
So, Tesla demonstrated strong vehicle sales growth yet again, as it has done from one quarter to the next almost continuously for the past 11 years. It's an impressive feat by any measure.
Will Tesla sales surprise positively again in the third quarter? We'll see. In the meantime, let us know what you think of Tesla's second-quarter sales as well as its big beat of Wall Street (and our) expectations.
All charts created by Zach Shahan | CleanTechnica.
Have a tip for CleanTechnica? Want to advertise? Want to suggest a guest for our CleanTech Talk podcast? Contact us here.
Latest CleanTechnica.TV Video

CleanTechnica uses affiliate links. See our policy here.