
EV Sales Rise to 7.2% of US Auto Sales, Tesla 4.3% of Auto Sales
In 2019, full electric vehicle (EV) sales were 1.4% of US auto sales. In 2020, they had risen to 1.7%, and in 2021, they had risen to 3%. Growth seemed a bit slow, too slow. However, in the past two years, things have changed much faster. In 2022, US EV sales accounted for 5.5% of the auto market, and last year (in 2023), EV sales rose to 7.2% of the auto market. We’re still far from European or Chinese levels, but we’re improving!
I’ll dig into the 2023 EV sales numbers in more detail in a coming report, but let’s look below at yearly trends in the US auto market first.


First of all, we can see that US auto sales rose 12% in 2024 compared to 2023, grew 1% compared to 2022 (the biggest bounceback year after the COVID-19 pandemic), and grew 7% compared to 2020. However, annual sales were still down 9% compared to 2019. In contrast, US EV sales nearly quintupled from 2019 to 2023 (they grew by 4.9 times, 385%).
In volume terms, the US auto market dropped by nearly 1.5 million units since 2019, but grew by more than 1.7 million units year over year. The EV market, meanwhile, grew by 888,490 units from 2019 to 2024. Year over year, the EV market grew by about 358,922 units.

The top four automakers in the US remained the three big dogs Toyota, Ford, Chevrolet, and a shrunken Honda. Honda still stands far above the remaining brands, but it has lost a lot of its volume, as you’ll see clearly in charts further down.
Tesla has become the 8th largest automaker in the country. The second largest 100% electric automaker, Rivian, is down in 29th place (out of 34 auto brands). Lucid is in 32nd place and BrightDrop in 34th. I expect Rivian could rise up the rankings quickly, targeting 100,000+ sales. As far as the other EV brands, we’ll see. BrightDrop needs big commercial buyers to order very high volumes of its EVs, and Lucid needs a more affordable model to arrive. Returning to the topic of Tesla, the next target for the Texas and California auto producer has to be 5th in the overall auto market. That position is fewer than 200,000 units away, that’s assuming the brands above it don’t lose sales.
The following charts highlight how automaker sales changed from 2022 to 2023, from 2021 to 2023, from 2020 to 2023, and from 2019 to 2023 — both in percentage terms and in volume terms. There’s a ton there to examine and think about, but it’s like a giant field of rabbit holes when it comes to writing an article on overall market trends, so I’m going to avoid most of those rabbit holes and get back to some of the biggest takeaways down below these charts. In this first one, though, I think it’s interesting to note that the three leaders in year-over-year percentage growth in auto sales were three EV brands — Rivian, BrightDrop, and Lucid. That is partly because we are shifting to electric vehicles in general, but it’s also definitely because they are extremely young brands starting from very low volumes, which makes it easier to score big percentage growth. Looking at the changes in volume growth in the next chart are much more sobering.


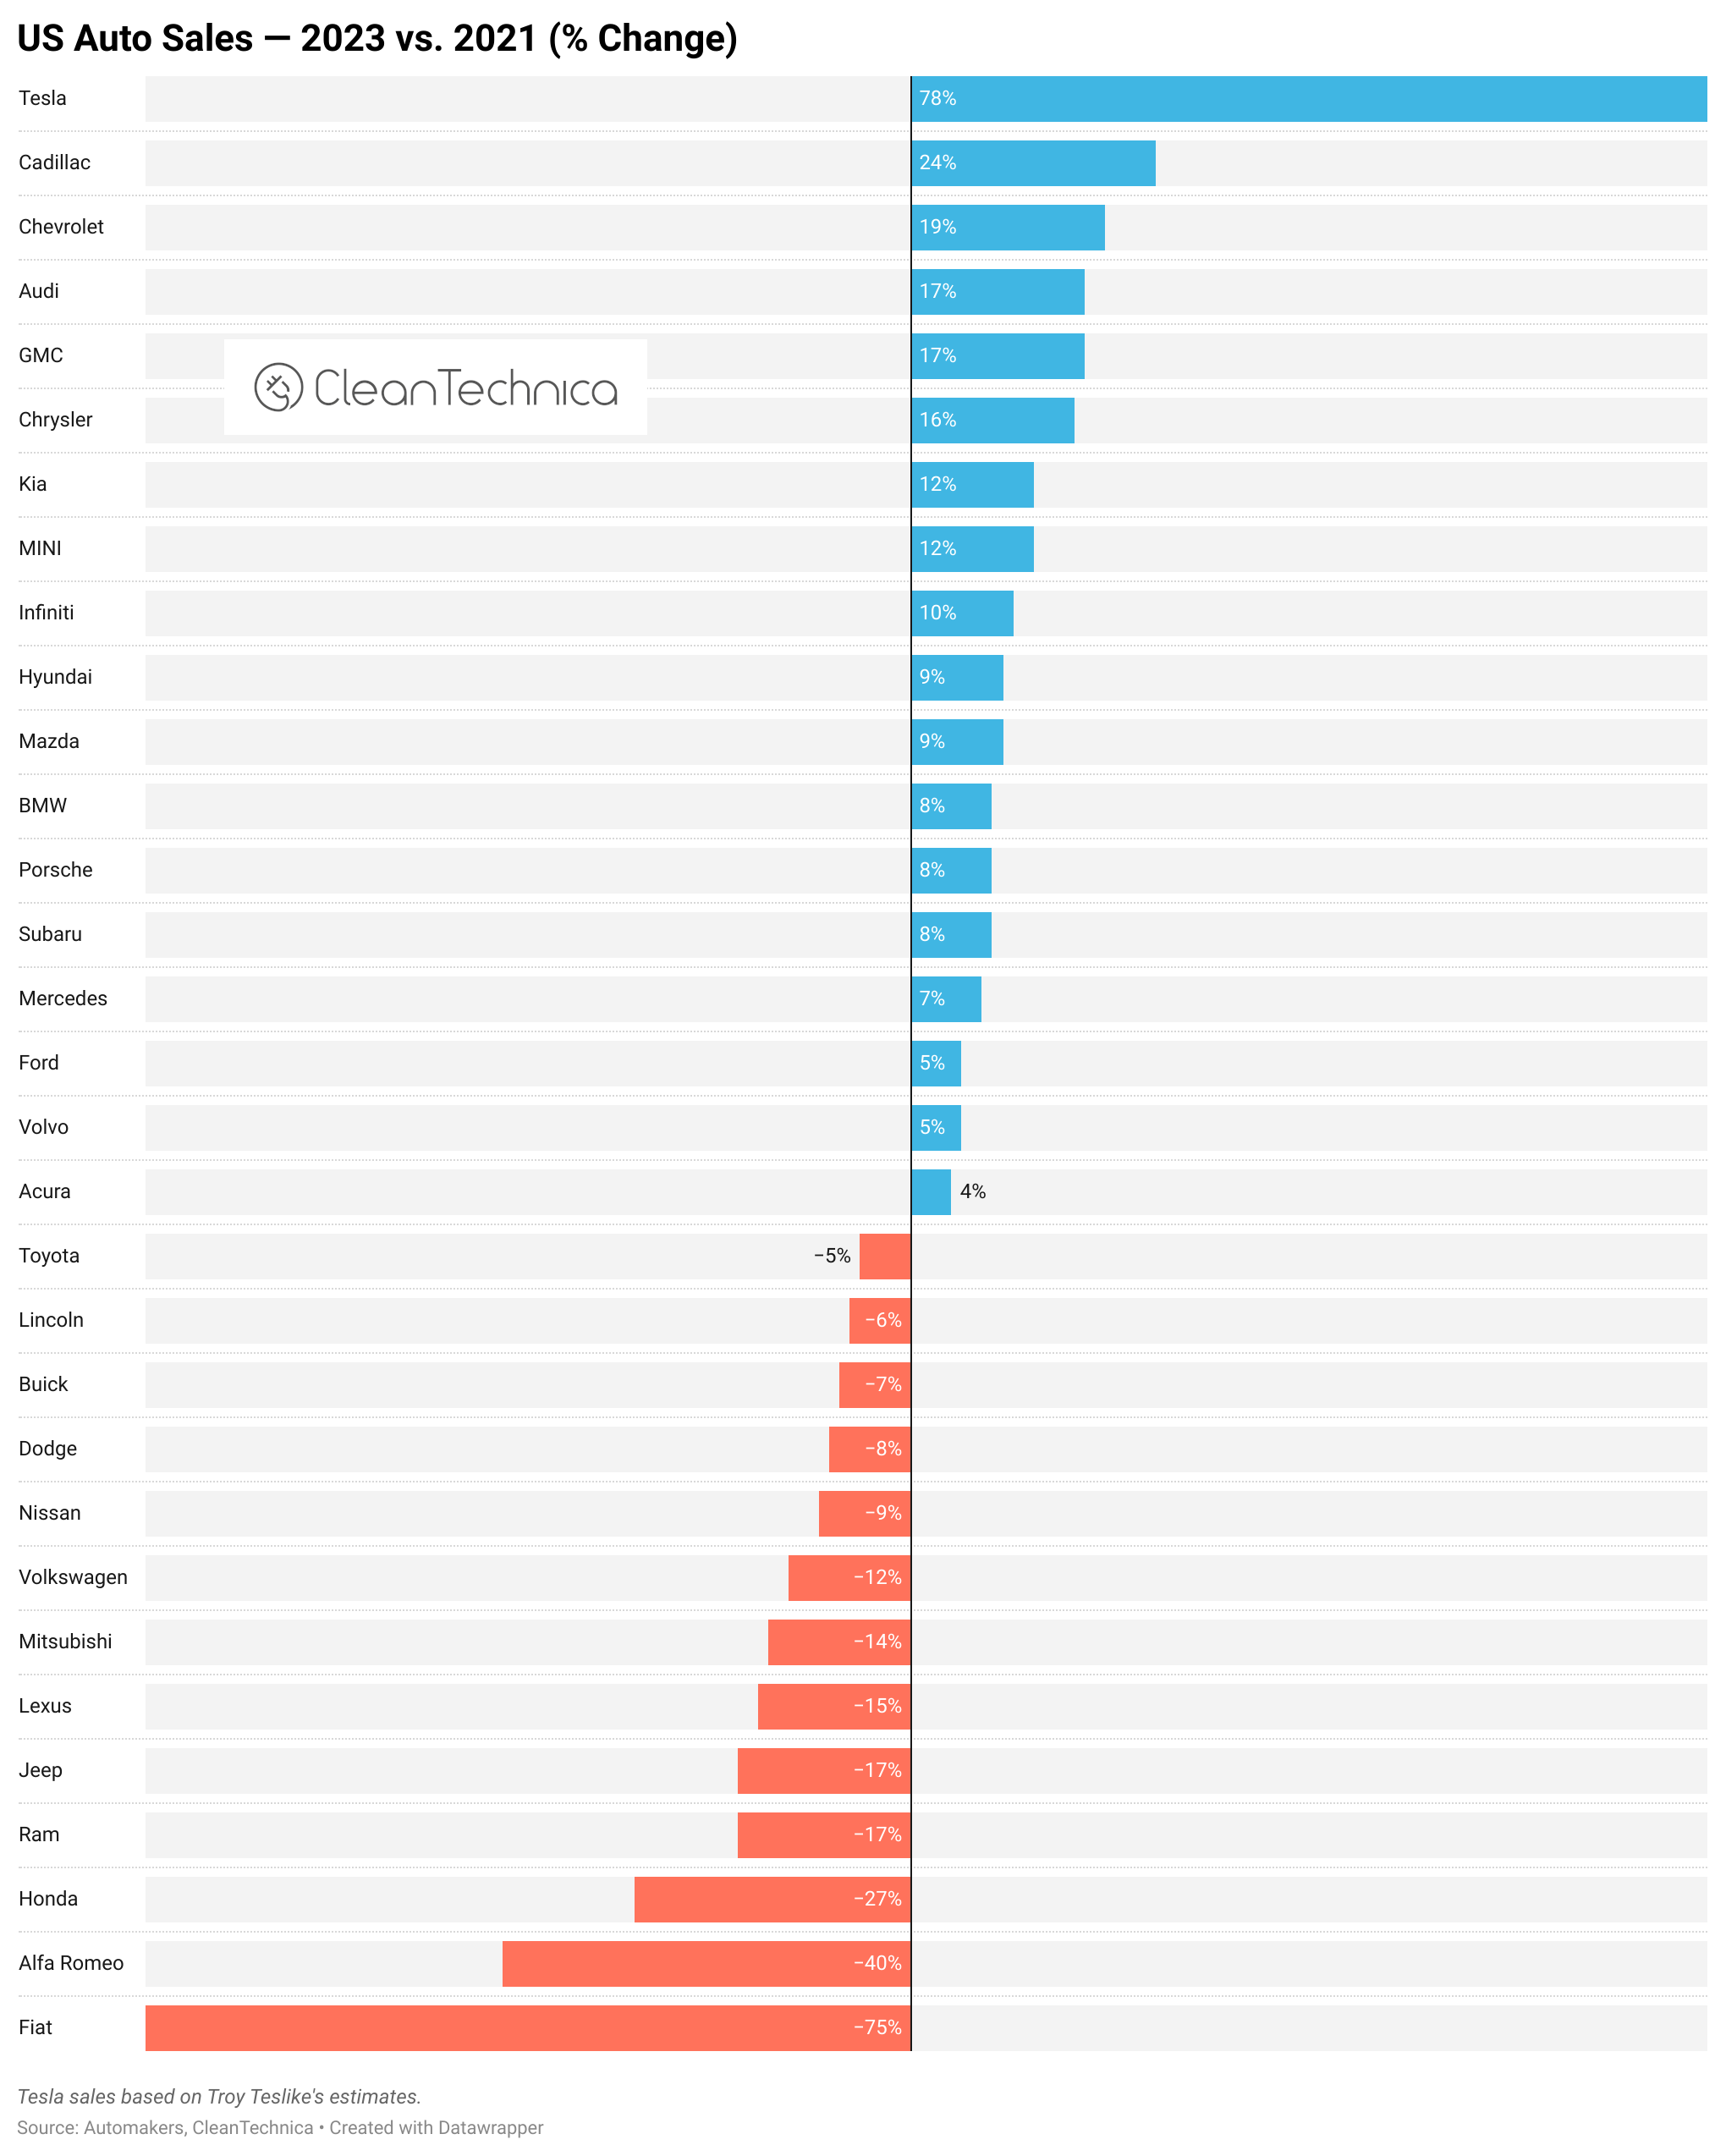


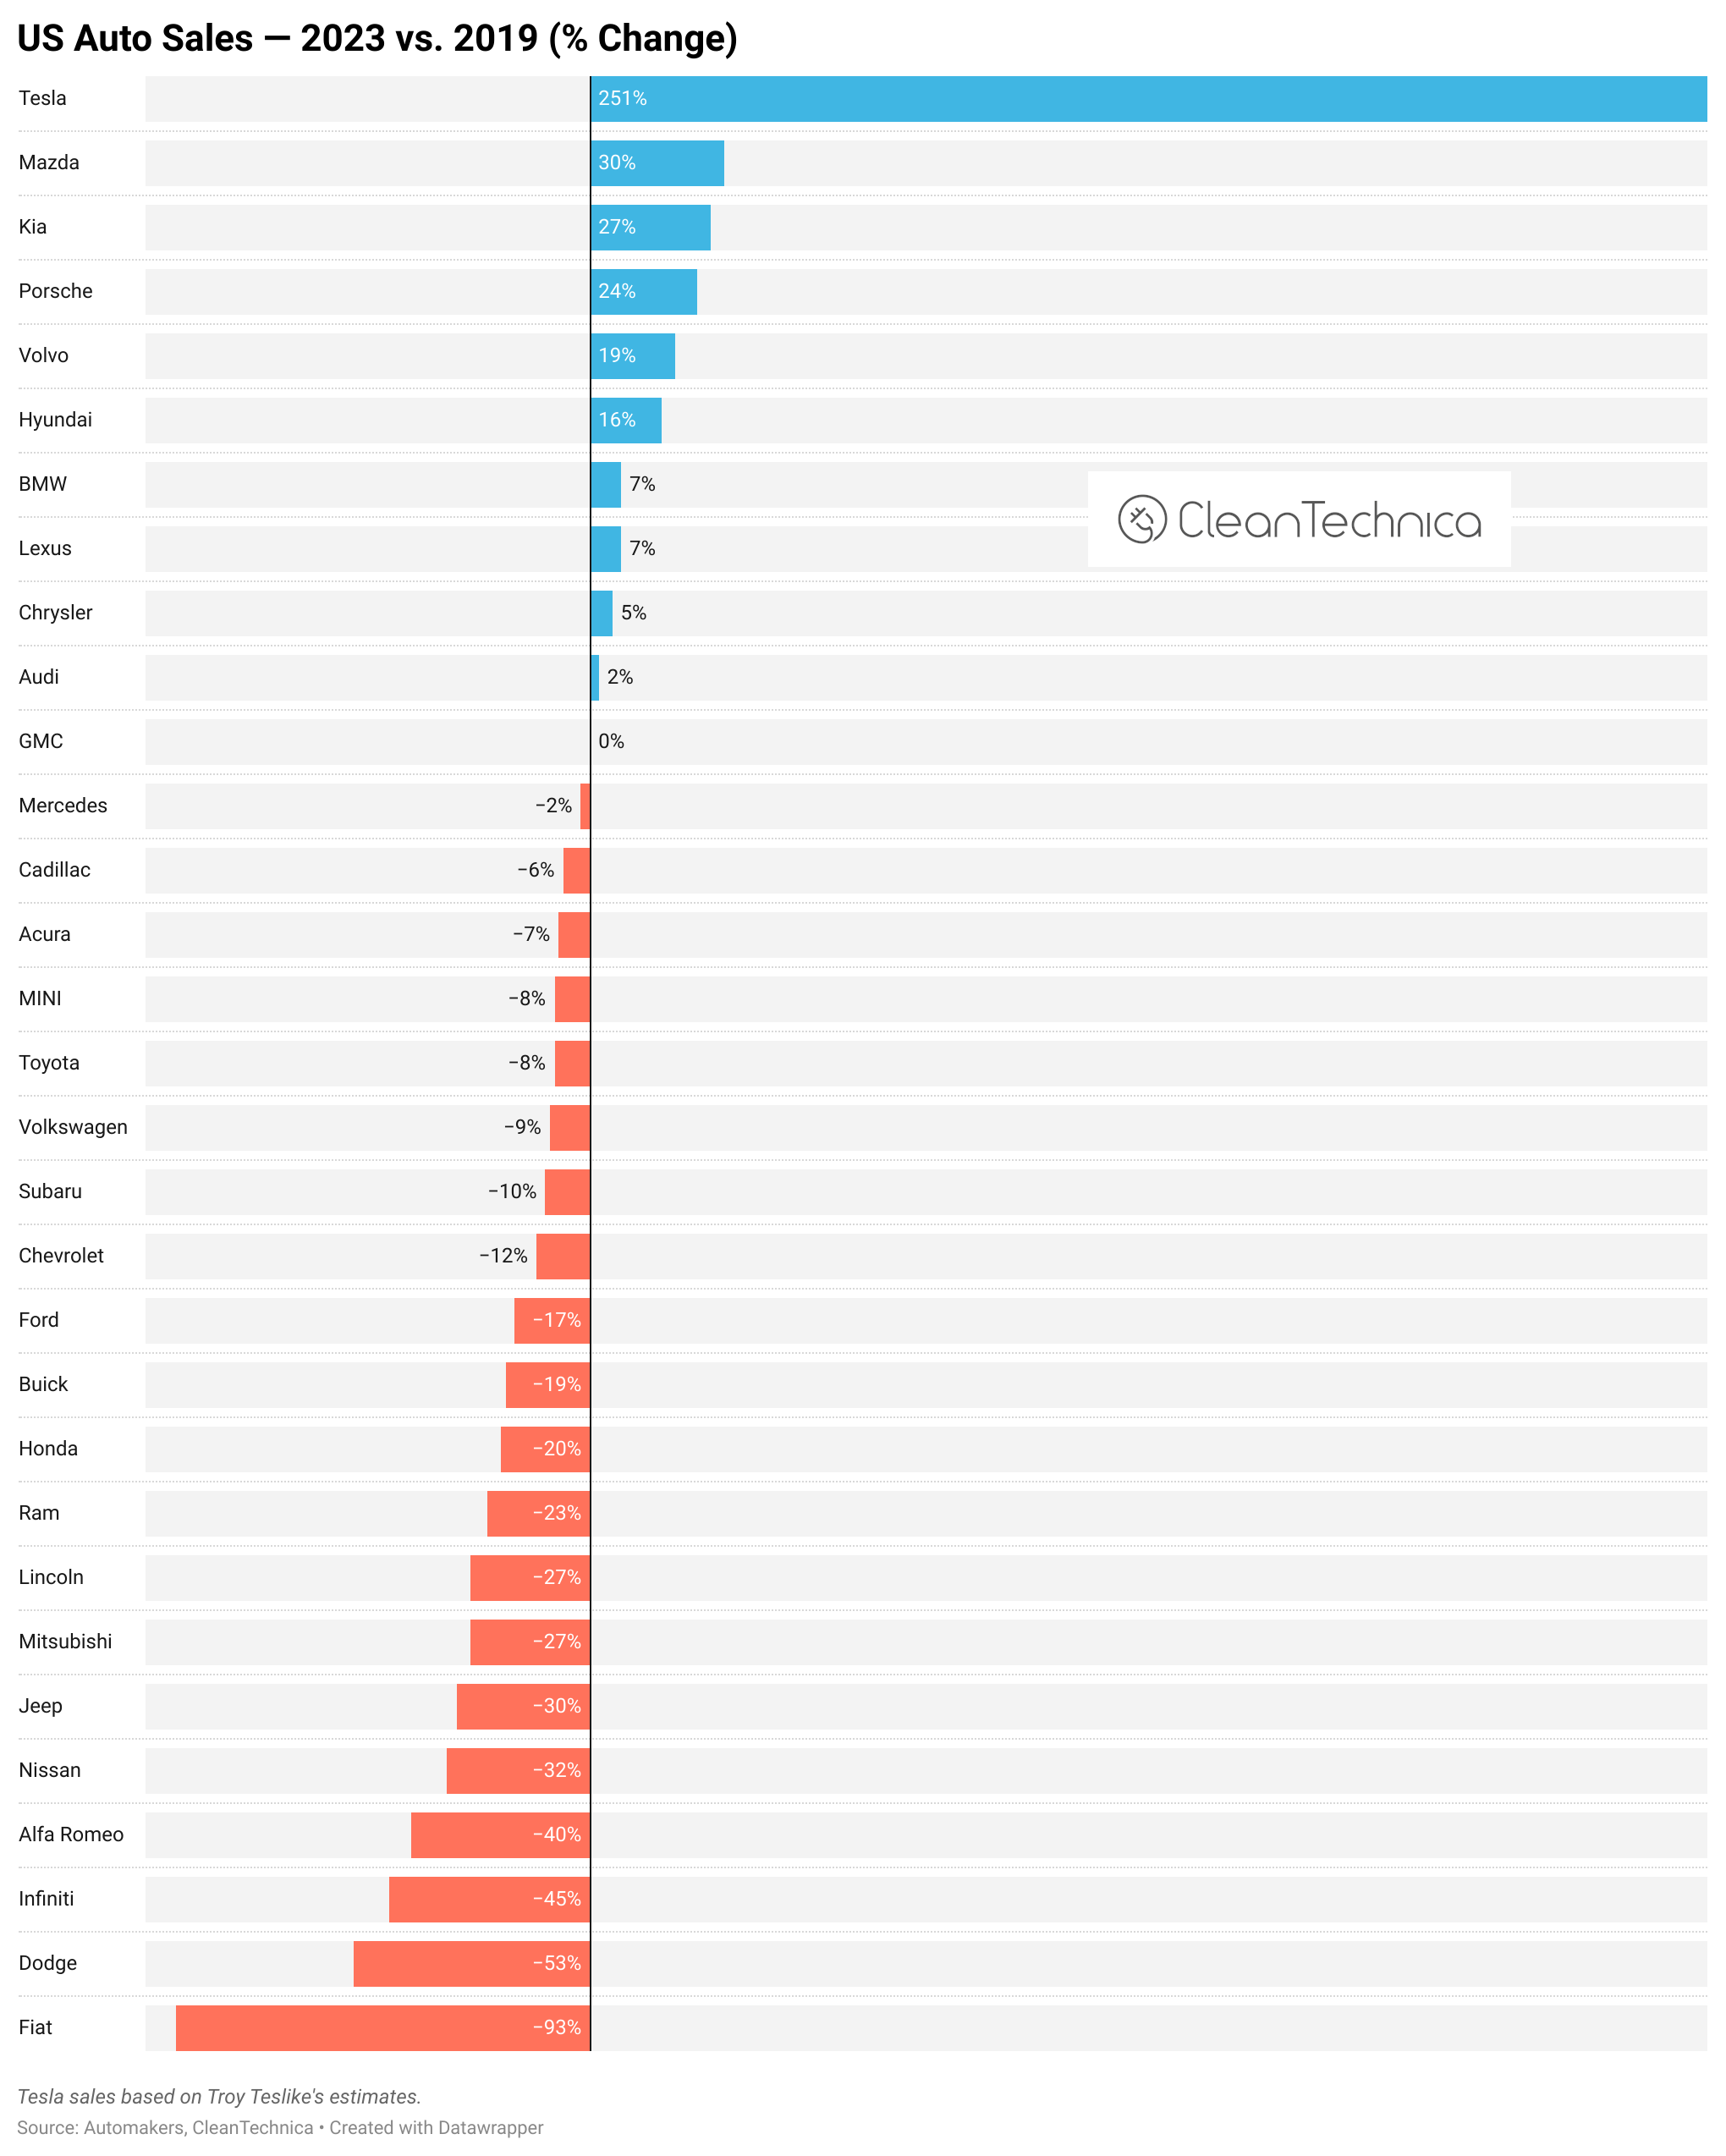
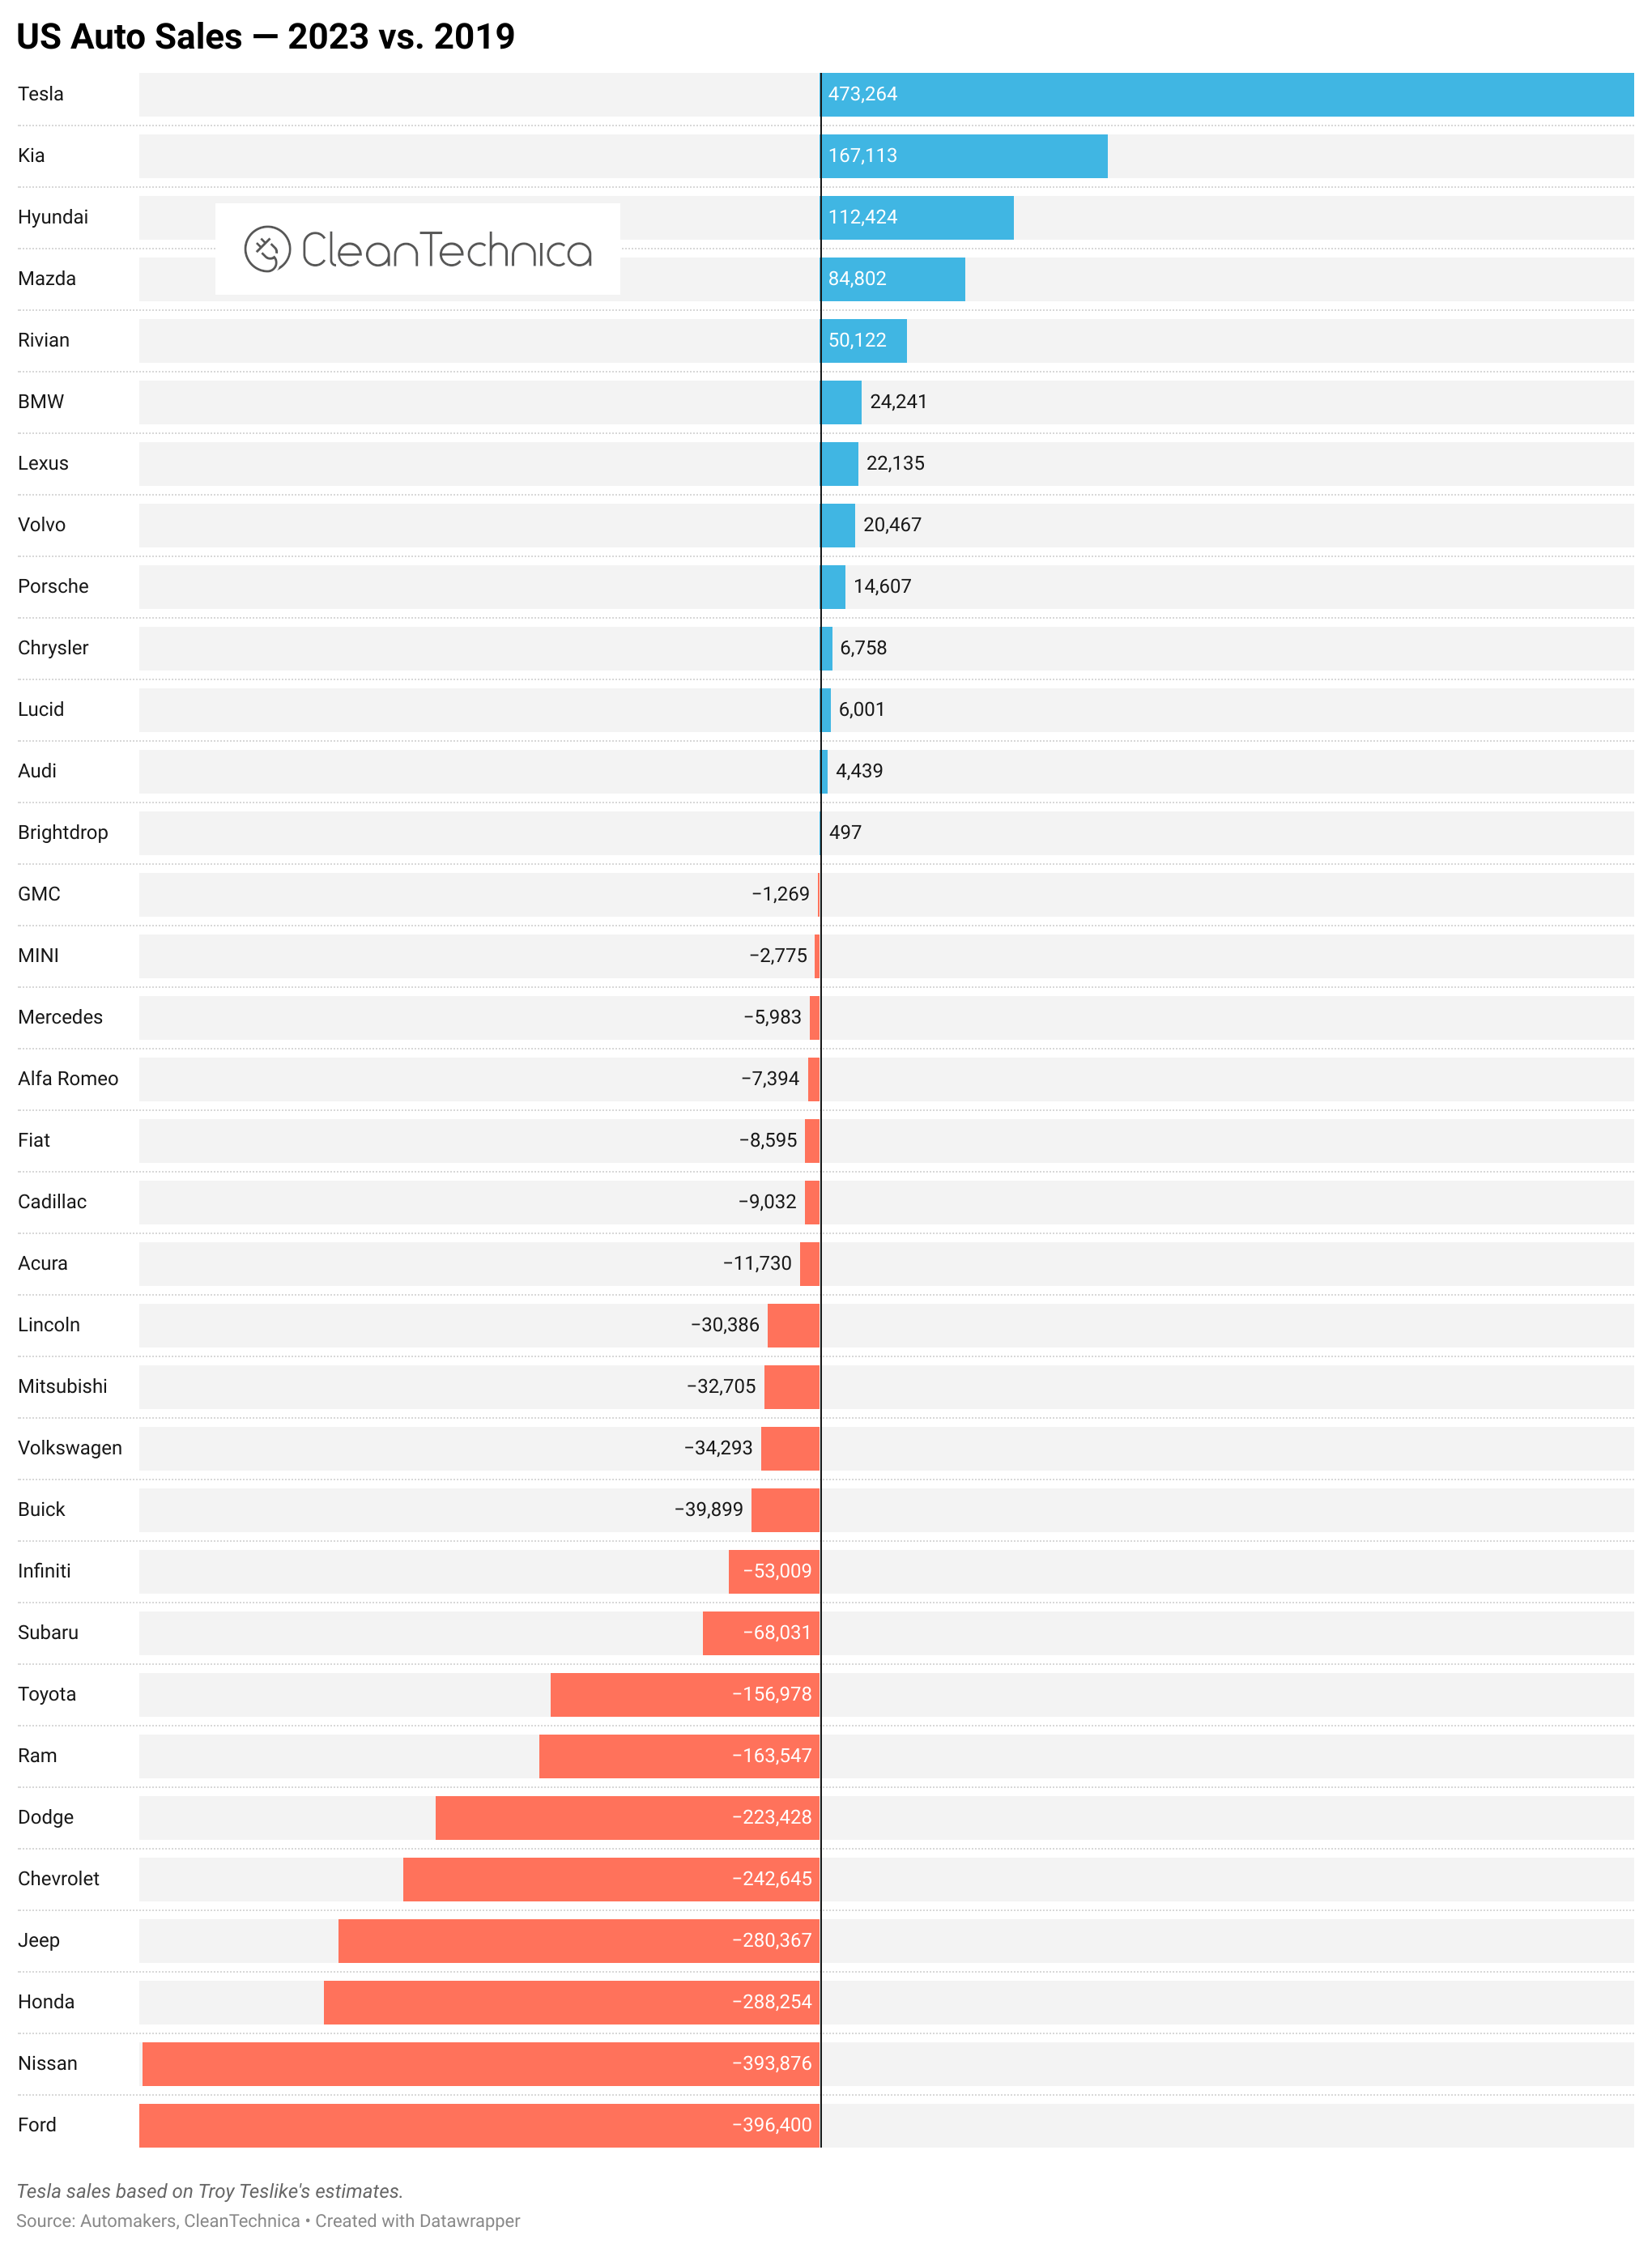
Diving all the way back to 2019, it is clear that Tesla has been the big positive story in the US auto market. It rose by nearly half a million sales a year in that timeframe, while giants like Dodge, Chevrolet, Jeep, Honda, Nissan, and Ford saw their annual sales drop by 220,000–400,000 units. Among legacy automakers, Kia and Hyundai have benefited from growing brand praise and popularity even in these disruptive times, and they also happen to be two of the leading EV producers among legacy brands. A little less obvious of a story than Tesla, it is good to see that Rivian had the 5th largest growth in volume terms — from nothing in 2019, 2020, or even 2021 to more than 50,000 sales in 2023. (It’s not in most of the percentage growth charts since I can’t include brands in those charts when they didn’t have two years of actual sales to compare.)
To wrap up, the following are three versions of the same chart. In the first one, the brand sales trends are sorted by 2023 sales. In the second one, they are sorted by 2019 sales. And then the third one is just an interactive version of the chart that’s very interesting to play with. The reason I created different version sorted by different years is because that makes it a little easier to visualize some of the massive brand leadership changes in the market. In the case of Tesla, for example, you can see it in 8th place in the first chart, but then way down in 20th place based on 2019 sales. That’s an impressive rise in a giant and long established market no matter how you look at it.


Have a tip for CleanTechnica? Want to advertise? Want to suggest a guest for our CleanTech Talk podcast? Contact us here.
Latest CleanTechnica.TV Video

CleanTechnica uses affiliate links. See our policy here.