Tesla Just Passed 4 Million Cumulative Sales (Charts)
Tesla sales hit yet another quarterly record in the 1st quarter of 2023. That was overshadowed by the fact that Tesla cut prices several times and gross margins dropped, but Tesla’s phenomenal progress increasing vehicle production and sales quarter after quarter almost without a break is worthy of its own story.
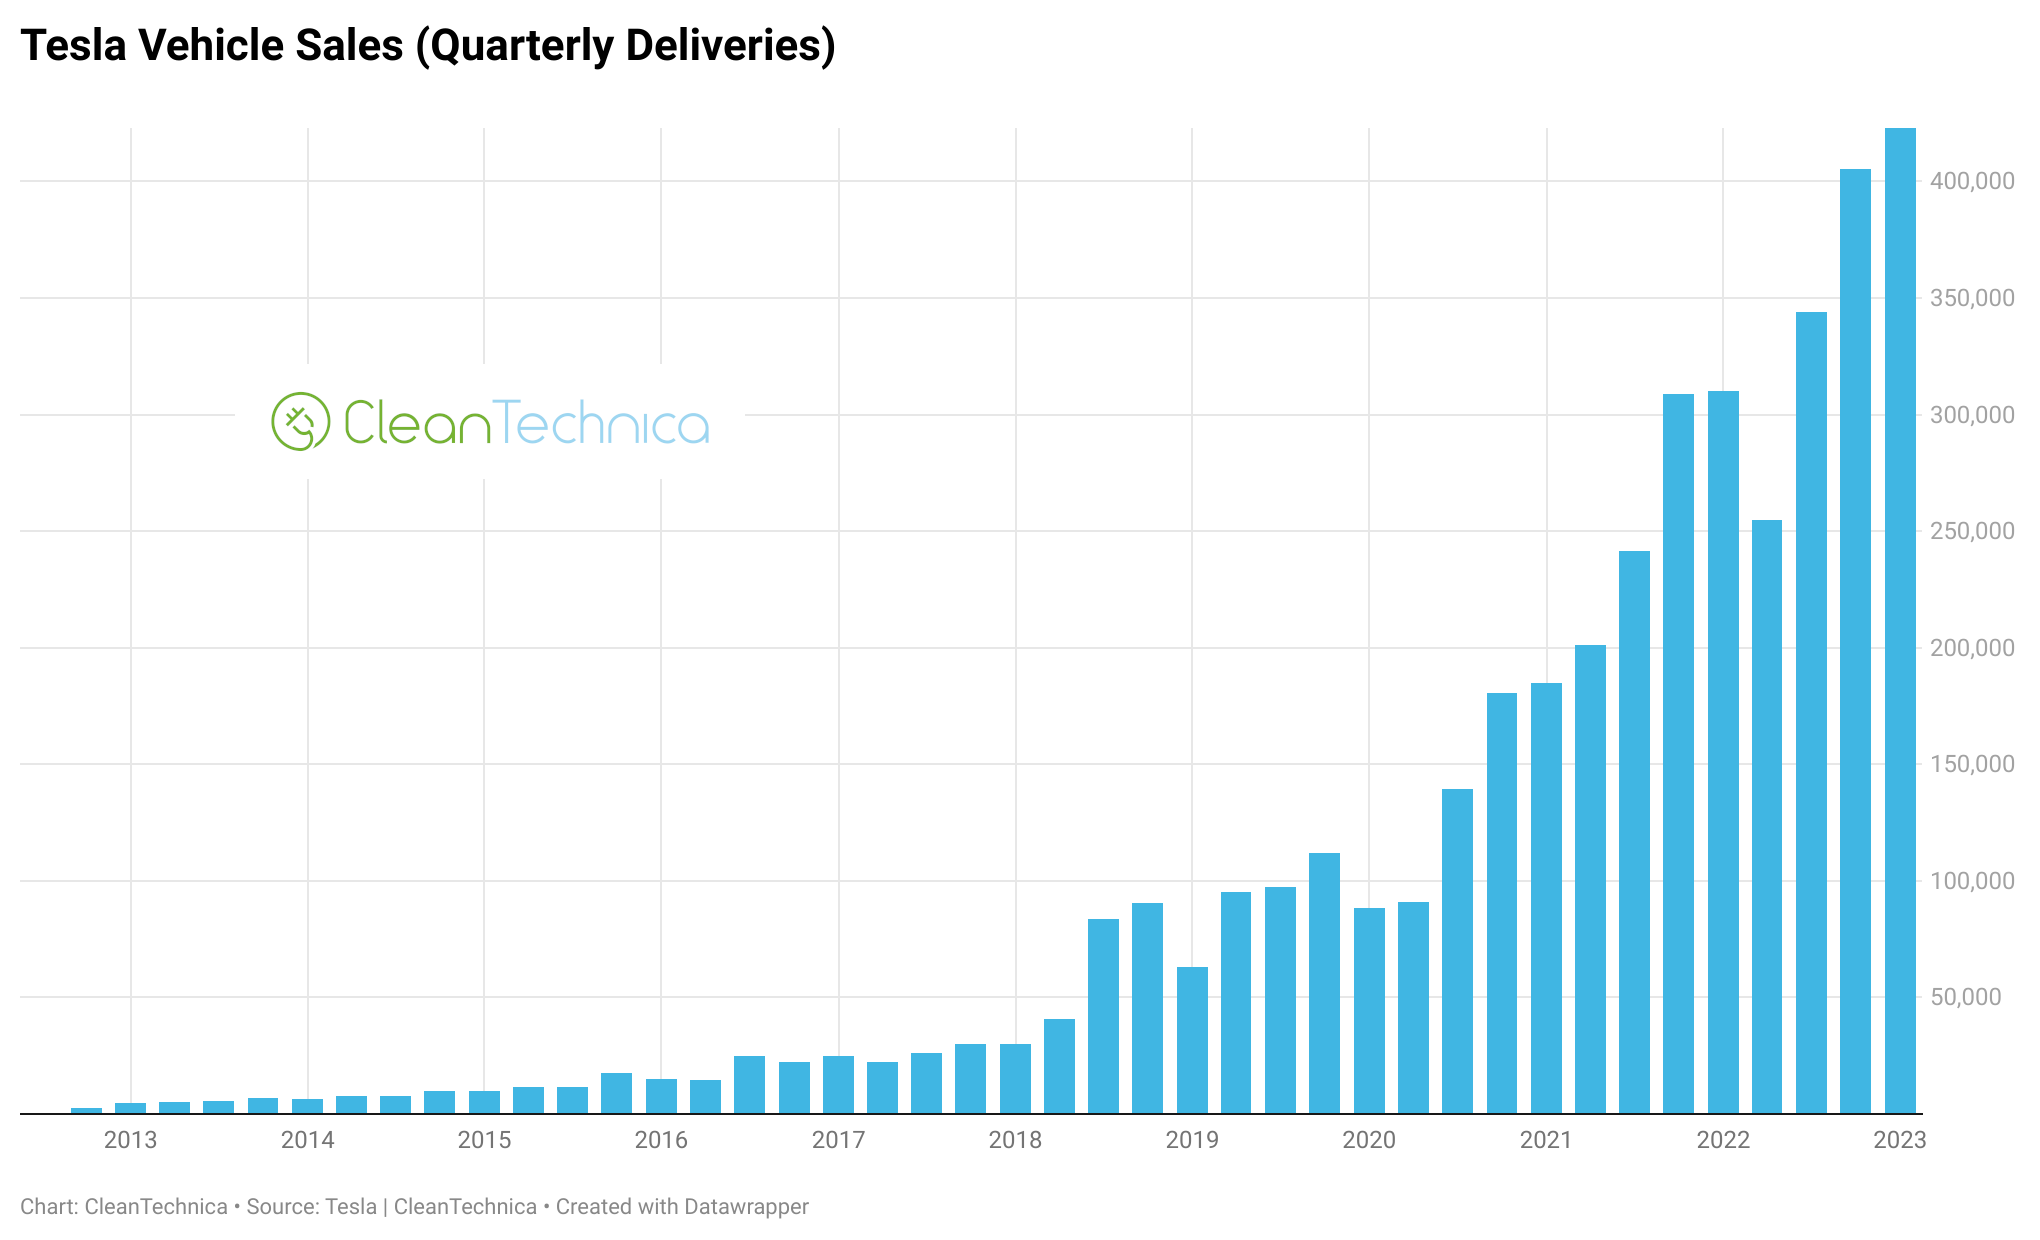
In 11 out of the last 12 quarters, Tesla’s sales (deliveries) rose compared to the quarter before. That’s every quarter except one in the past 3 years that the company saw quarter-over-quarter sales. Furthermore, the start of that trend was when the COVID-19 pandemic hit, and related economic shutdowns around the world. If you assume the two weak quarters in 2020 from those shutdowns had followed the normal trend, then 15 out of the last 16 quarters would have shown quarter-over-quarter growth. The funny thing is that in every year of that chart, there were many claims from Tesla critics that Tesla customer demand was peaking and quarterly sales would never be higher again.
Before getting back to the bar charts, though, let’s have a quick look at Tesla’s cumulative sales numbers.

The chart above shows an almost perfect example of exponential growth. It looks like the first half of the famous S-curve of disruptive technology adoption. All in all, Tesla’s growth looks solid and enviable.
That’s overall cumulative sales growth, but it’s perhaps more interesting to split out cumulative Tesla Model 3 and Model Y sales growth.


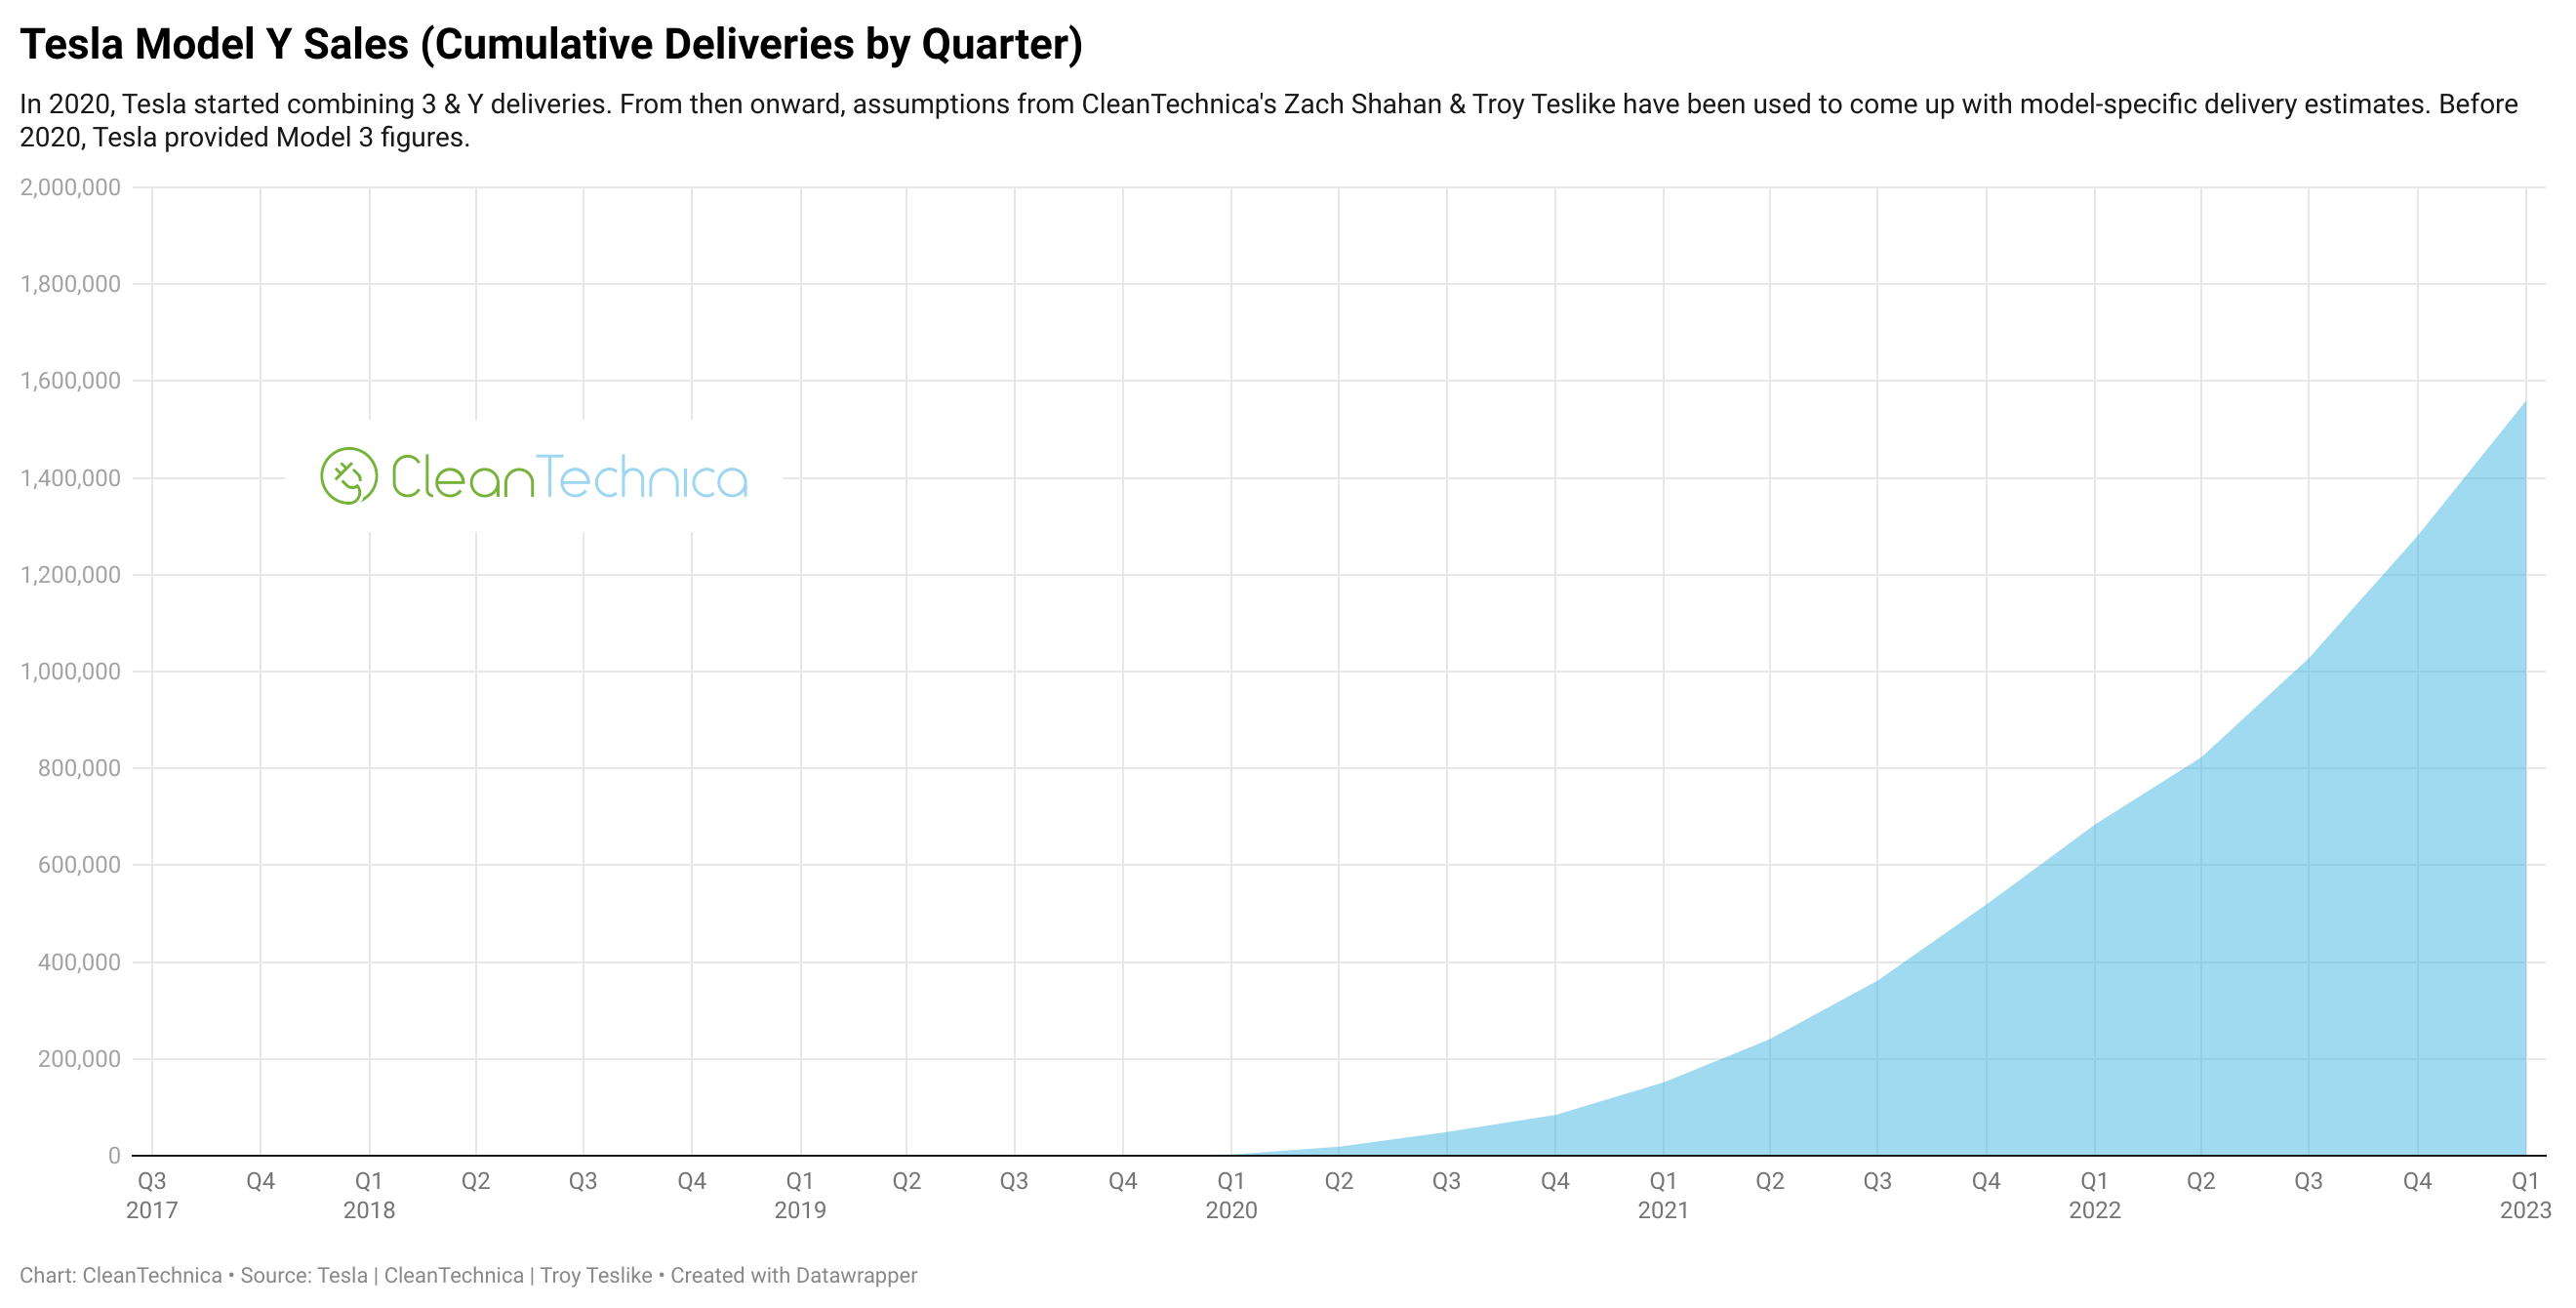
As you can see in those charts above, while Tesla Model 3 cumulative sales continued to go up steadily, it was the arrival of the Tesla Model Y and its rapid ramp-up that really kept Tesla on that overall exponential growth curve. In fact, the Model Y is catching up to the Model 3 fast. Its cumulative sales have risen to almost 1.6 million, while Model 3 cumulative sales are just a bit higher at about 1.9 million. We could well see the Model Y surpass the Model 3 in cumulative sales by the end of 2023! That’s a bit mind blowing when you consider how quickly and how hugely the Model 3 shattered EV sales records, and records beyond the EV industry.
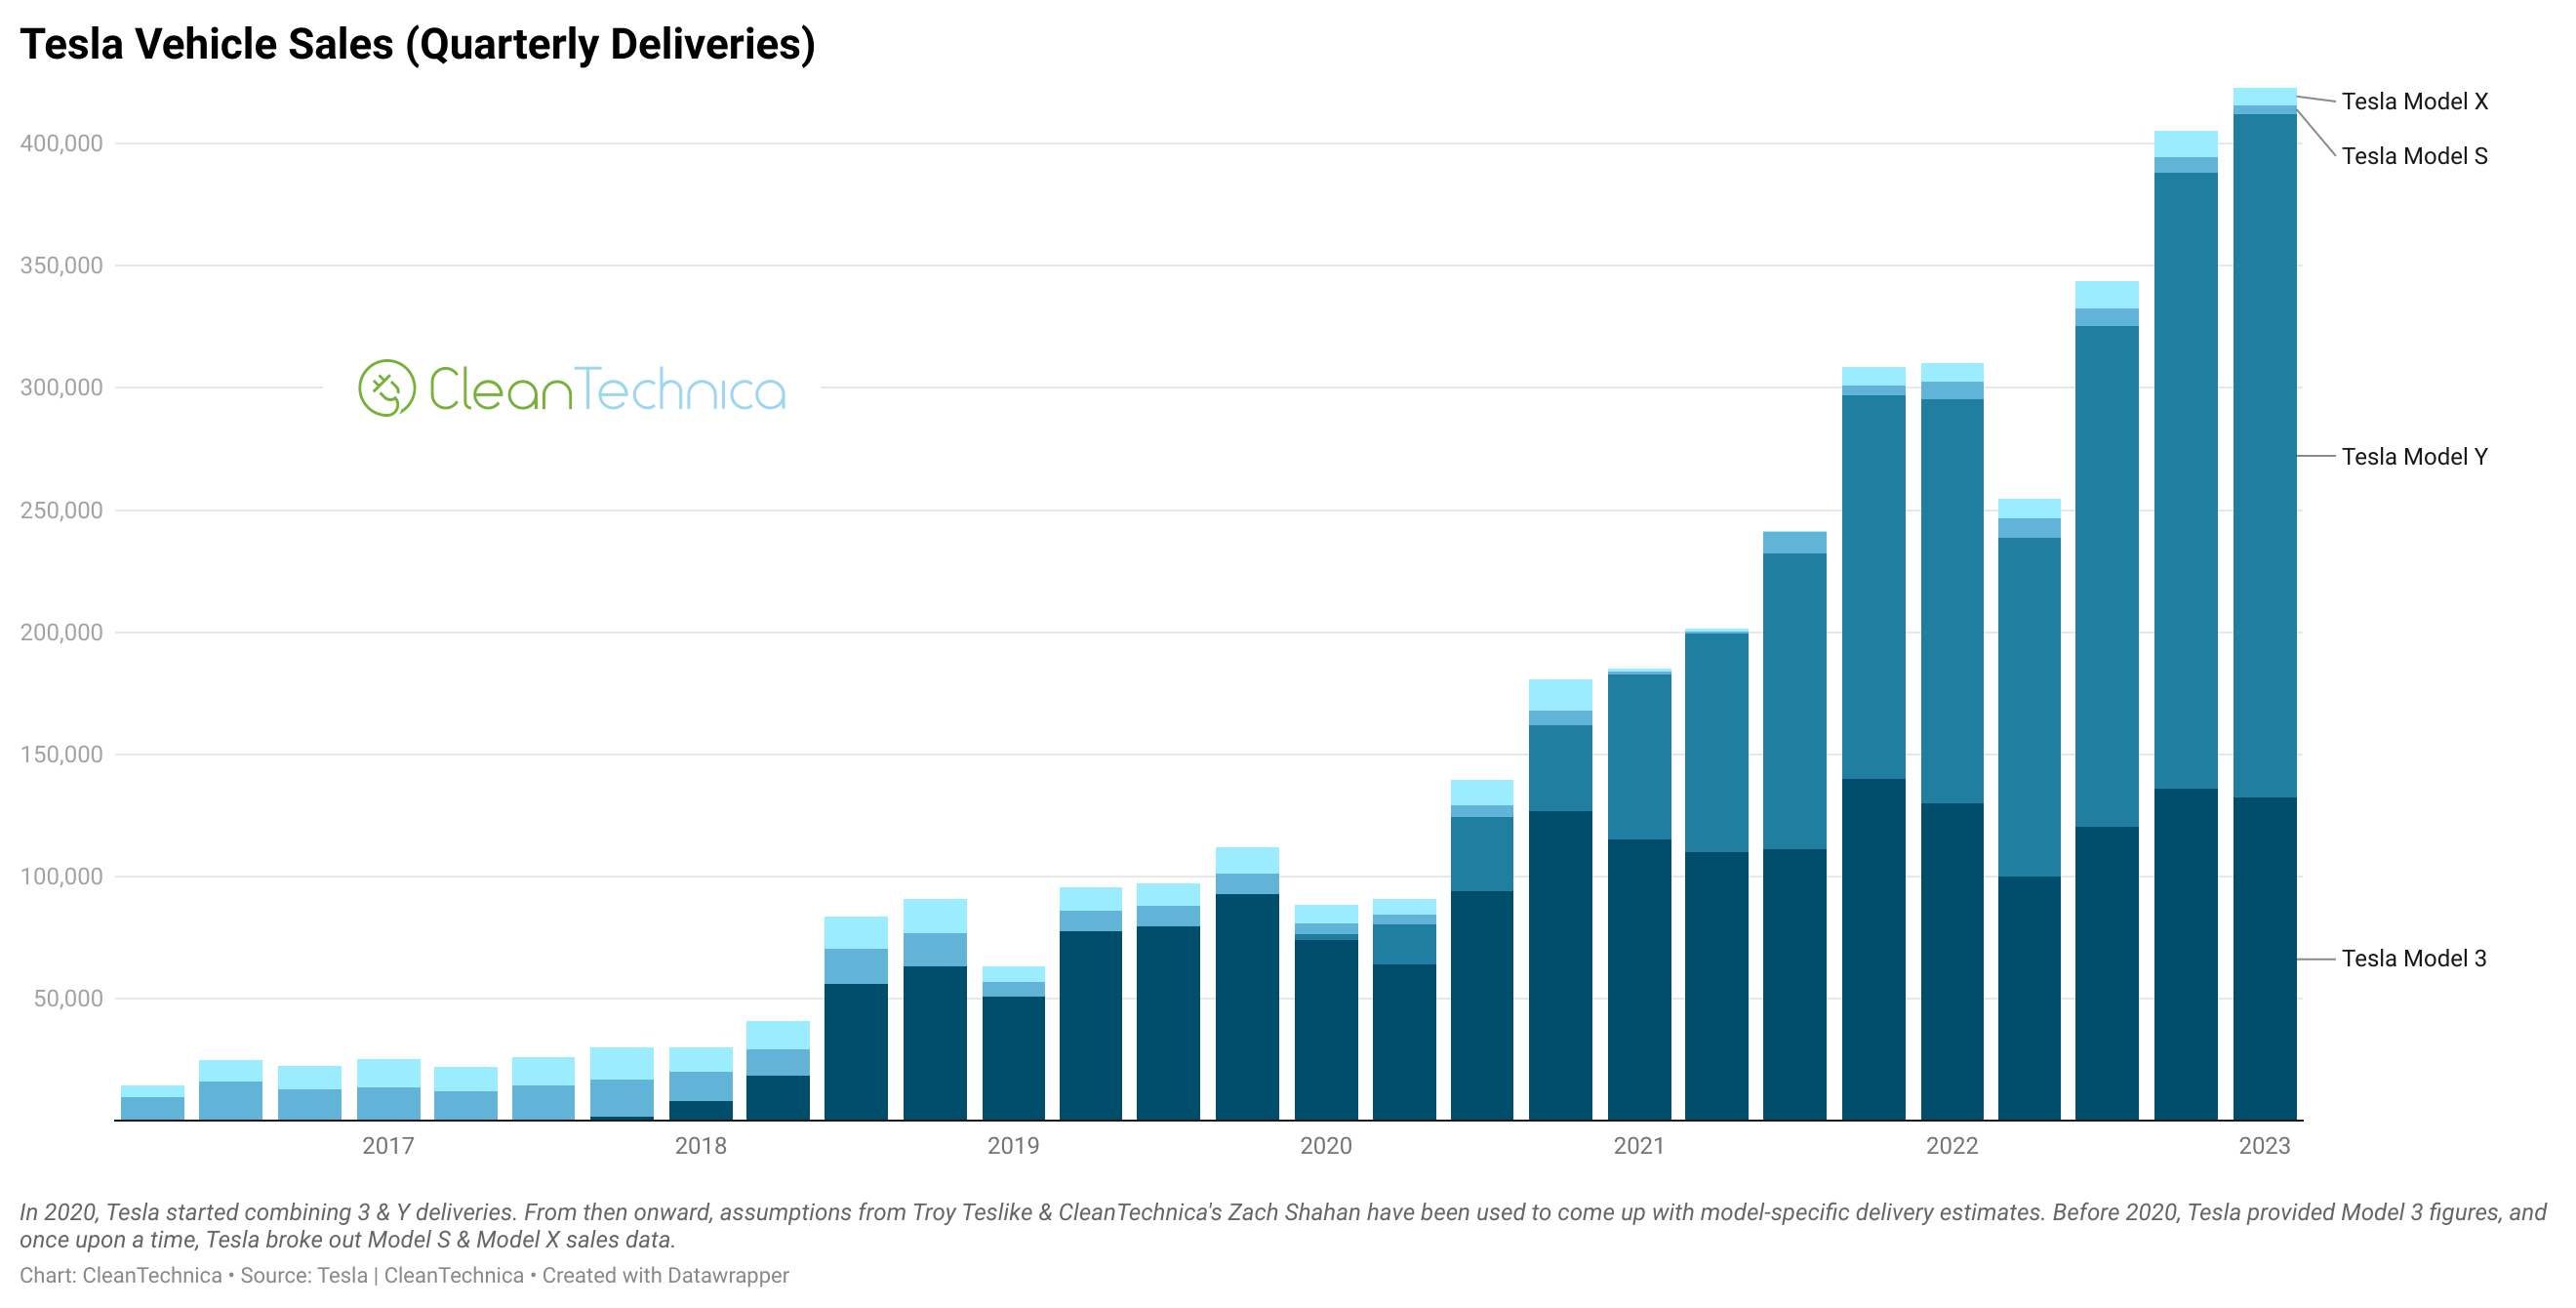
Getting back to a bar chart, this one above again shows Tesla’s quarterly sales trend, but this time indicating each quarter’s model sales. The standout visual here, yet again, is how much Model Y sales grew and contributed to Tesla’s rising quarterly sales. One has to wonder: how high can the Model Y go? It was already the 4th best selling automobile in the world in 2022.
For the last two graphics (before the interactive charts, which include one more type of chart), we’ve got a couple of line graphs.


These line graphs indicate quarterly Tesla sales, just as the bar charts above did, but looking at the visual representations in this other way helps to picture from another viewpoint what is driving Tesla sales. I find the Model Y’s growth trend staggering, and it’s worth noting that the vehicle is on track for more than a million sales in 2023 after the 1st quarter.
Those sales charts are fun, but what’s even more fun are the interactive versions below. Be sure to get on an actual computer to maximize the fun. The on chart that’s new here is the one with the red bars. On that chart, you can toggle between the models to see quarterly bar charts for each of them. The scale changes depending on the model, which takes away some of the comparison potential, but this chart is more about zeroing in on the sales trends of each model individually.
As a final note, remember that the model-specific sales figures are not official Tesla figures. Tesla combines sales of the Model 3 and Model Y (which is downright annoying, especially considering that no other automaker does this with such clearly different models) and sales of the Model S and Model X (ditto). The way I split out model sales here is now most heavily informed by Troy Teslike’s tracking of production and sales, and his resulting estimates.
 Chip in a few dollars a month to help support independent cleantech coverage that helps to accelerate the cleantech revolution!
Anything missing here that you'd like to see in upcoming Tesla quarterly sales reports?
Have a tip for CleanTechnica? Want to advertise? Want to suggest a guest for our CleanTech Talk podcast? Contact us here.
Latest CleanTechnica.TV Video

CleanTechnica uses affiliate links. See our policy here.