Who (Besides the EI Blog) Pays Attention to Electricity Prices?
A new study finds a large household response to electricity prices in the long run.
The law of demand is as close as we economists get to an immutable law in our universe. When a product’s price increases, consumer demand for that product should decrease. To my economist’s eye, this law has all the elegance of Newton’s law of gravity or Ohm’s law of electricity. But its real-world application is messier because economic laws govern the behavior of humans instead of particles or electrons.
 Source: here and here.
Energy economists spend a lot of time thinking about how the law of demand applies to energy markets. If you think this sounds snoozy, think again. Energy demand elasticities, which summarize how consumers respond to energy price changes, are key inputs in the models and analysis that guide big-ticket energy infrastructure investments, electricity market regulations, and climate policy interventions. If these elasticity estimates are wrong, our models will mislead.
Economists have had some success at estimating electricity demand elasticities over the short run (see here and here). These short-run elasticities are the numbers that are typically baked into energy policy modeling (see here, for example). But many energy investments and policy decisions have long-run energy price ramifications. In the long run, I can do more than turn off my AC when electricity prices go up. I can invest in a more efficient one! So we should expect larger demand responses over longer periods of time as people find opportunities to take more significant actions. How much larger has been hard to pin down.
To estimate this long-run response, you might be tempted to compare the electricity consumption across consumers who have historically faced different electricity prices (think California versus Nevada). But that strategy is fraught because there are lots of confounding factors that differ across Californians and Nevadans that could generate differences in electricity consumption, like weather, housing stock, or lifestyles…

Source: Nevada, California.
A new Energy Institute Working paper by EI alum Jesse Buchsbaum takes a new approach to this challenge. Jesse leverages a quirky feature of California’s retail electricity rate design that generates sustained differences in retail electricity prices across otherwise nearly identical households. Making these apples-to-apples comparisons, he finds that households that have historically faced higher electricity prices consume significantly less electricity.
A Clever Use for Quirky Electricity Rates
Our California readers may not even realize that the electricity prices they pay depend in part on what electricity “baseline territory” they happen to live in. Climate-differentiated electricity pricing is designed to mitigate some of the electricity bill impacts of living in a place that requires lots of cooling or heating to stay comfortable. Jesse uses data from PG&E’s service territory which spans the scorching summers of Fresno and the snowy winters of the Sierras.
The graph below provides an example of how the electricity price structure in my pricing zone (Zone T) differs from my friend Max’s pricing zone (Zone X). You can see that baseline territory pricing means Max can consume more electricity at the lower rate of 20 cents/kWh than I can because his micro-climate is hotter than mine.
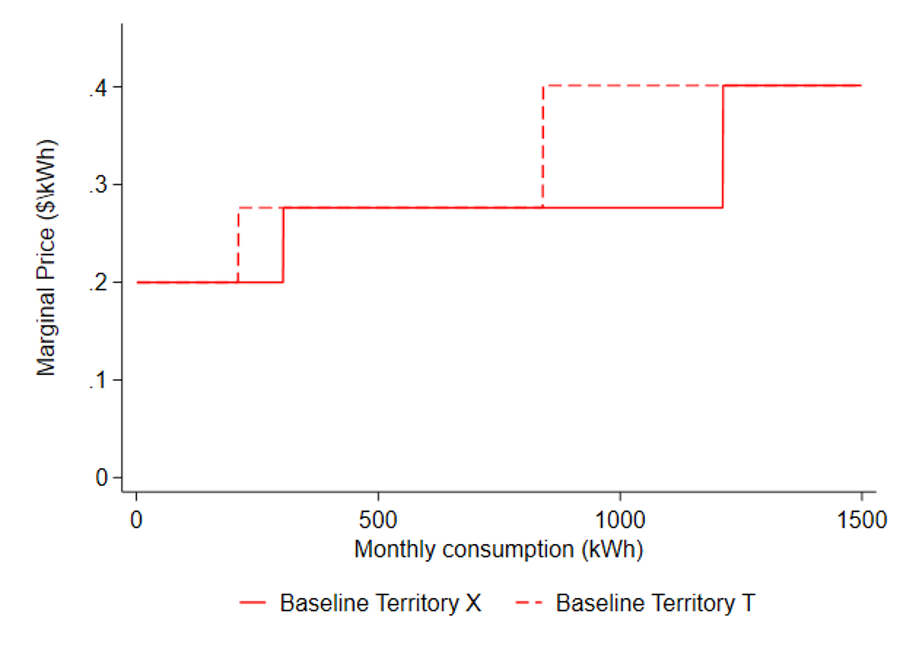
Jesse’s paper leverages the fact that, whereas electricity rates change discontinuously when you cross a territory border, other factors (e.g. household income, climate) do not. So any differences in electricity consumption patterns can reasonably be attributed to the electricity price differences. He compares electricity demand across neighbors living very close to these borders to see how demand changes as you move from the low-price zone to the high-price zone.
Do consumers respond to electricity prices?
Jesse starts by looking at how households respond to month-to-month variation in price schedules. Periodic adjustments can move prices differently on either side of a territory border. In the short run, he finds that a 1% increase in retail electricity prices induces a demand reduction of 0.3% (or around 1.5 kWh per month on average for the households in the study). These estimates are in line with prior estimates of short-run elasticity estimates (see, for example, here).
Using more than 10 years of billing data, Jesse can also assess the longer-run impacts of sustained price differences generated by climate zones. He finds some remarkably large effects. Over multiple years, a 1% electricity price difference is associated with more than a 2% difference in household electricity demand (on average).
This is a surprisingly large elasticity estimate. But it is possible if people are considering their electricity bills when it’s time to remodel the house, purchase an air conditioner, replace the water heater, etc. So Jesse’s been doing some econometric detective work to try and figure out what could be driving such large effects.
One part of the explanation appears to be…space cooling. The picture below summarizes how electricity consumption increases with higher temperatures (or cooling-degree days). As the temperature rises, more people turn on their air conditioning which drives consumption up.
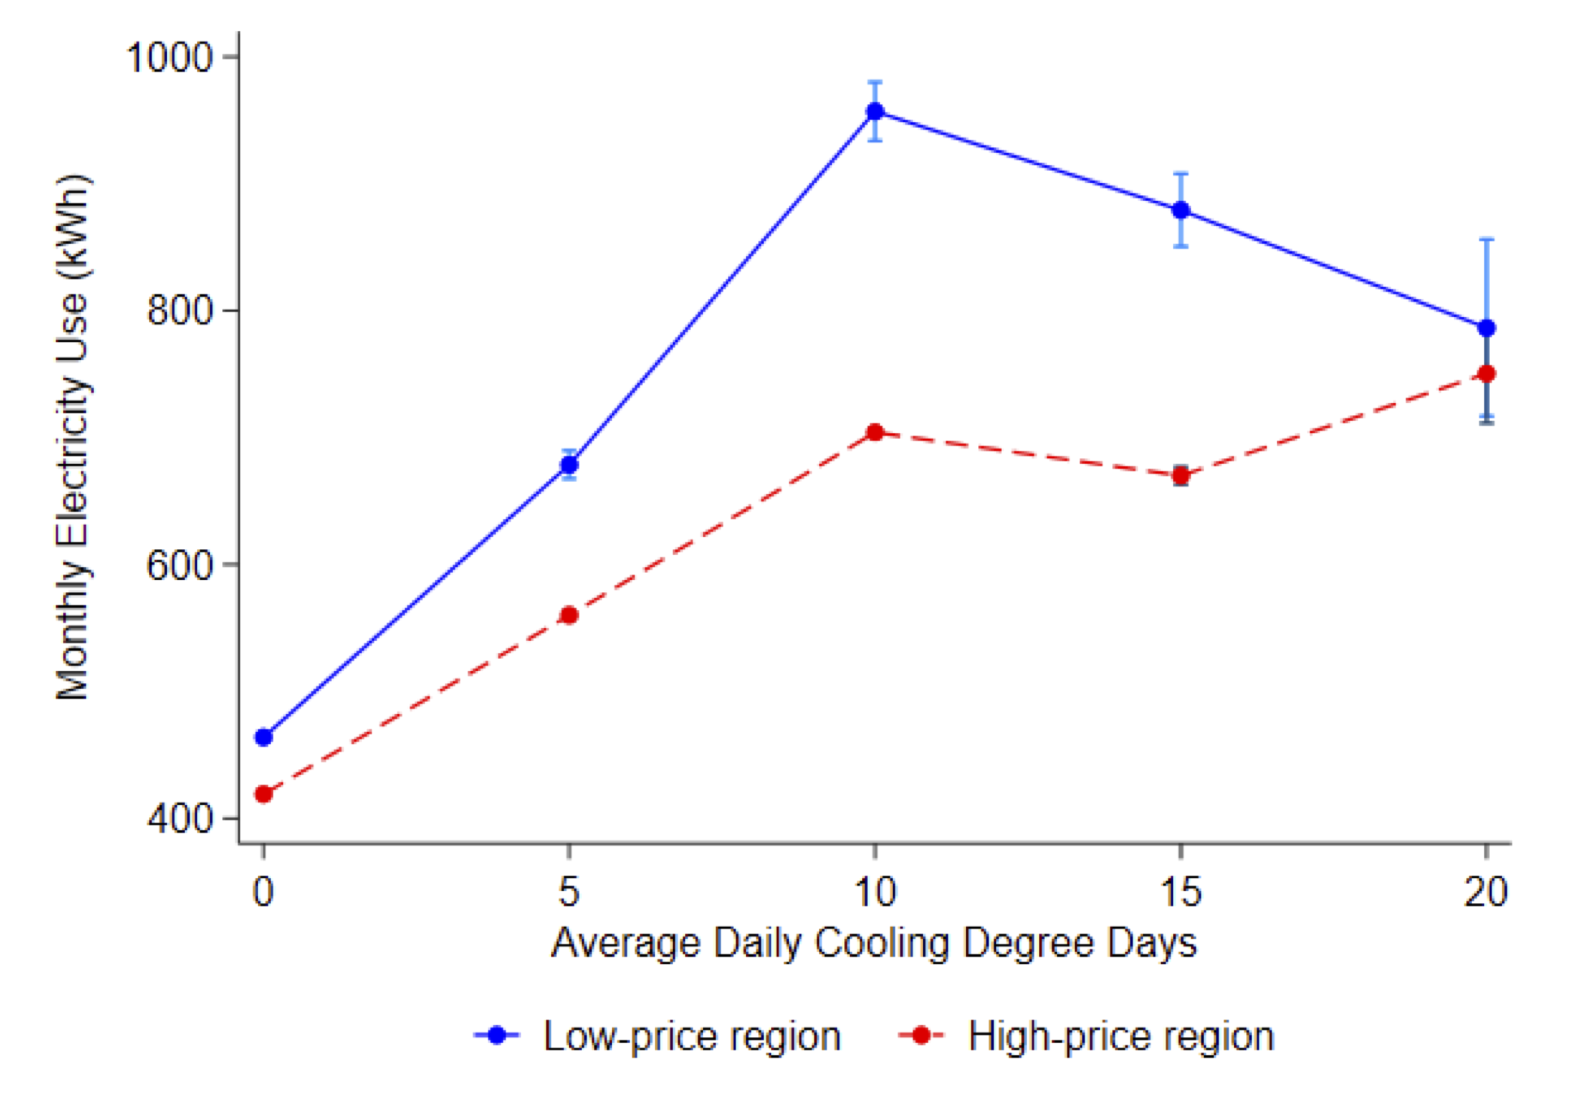
You can clearly see that this electricity demand response to warmer temperatures (i.e. more cooling degree days) is significantly higher among households on the lower-price side of zone borders (blue line). This is consistent with people using AC less – or investing more in energy-efficient cooling – when electricity costs more.
Jesse finds a similar -albeit harder to interpret- pattern when he estimates the relationship between average electricity consumption and heating degree days:
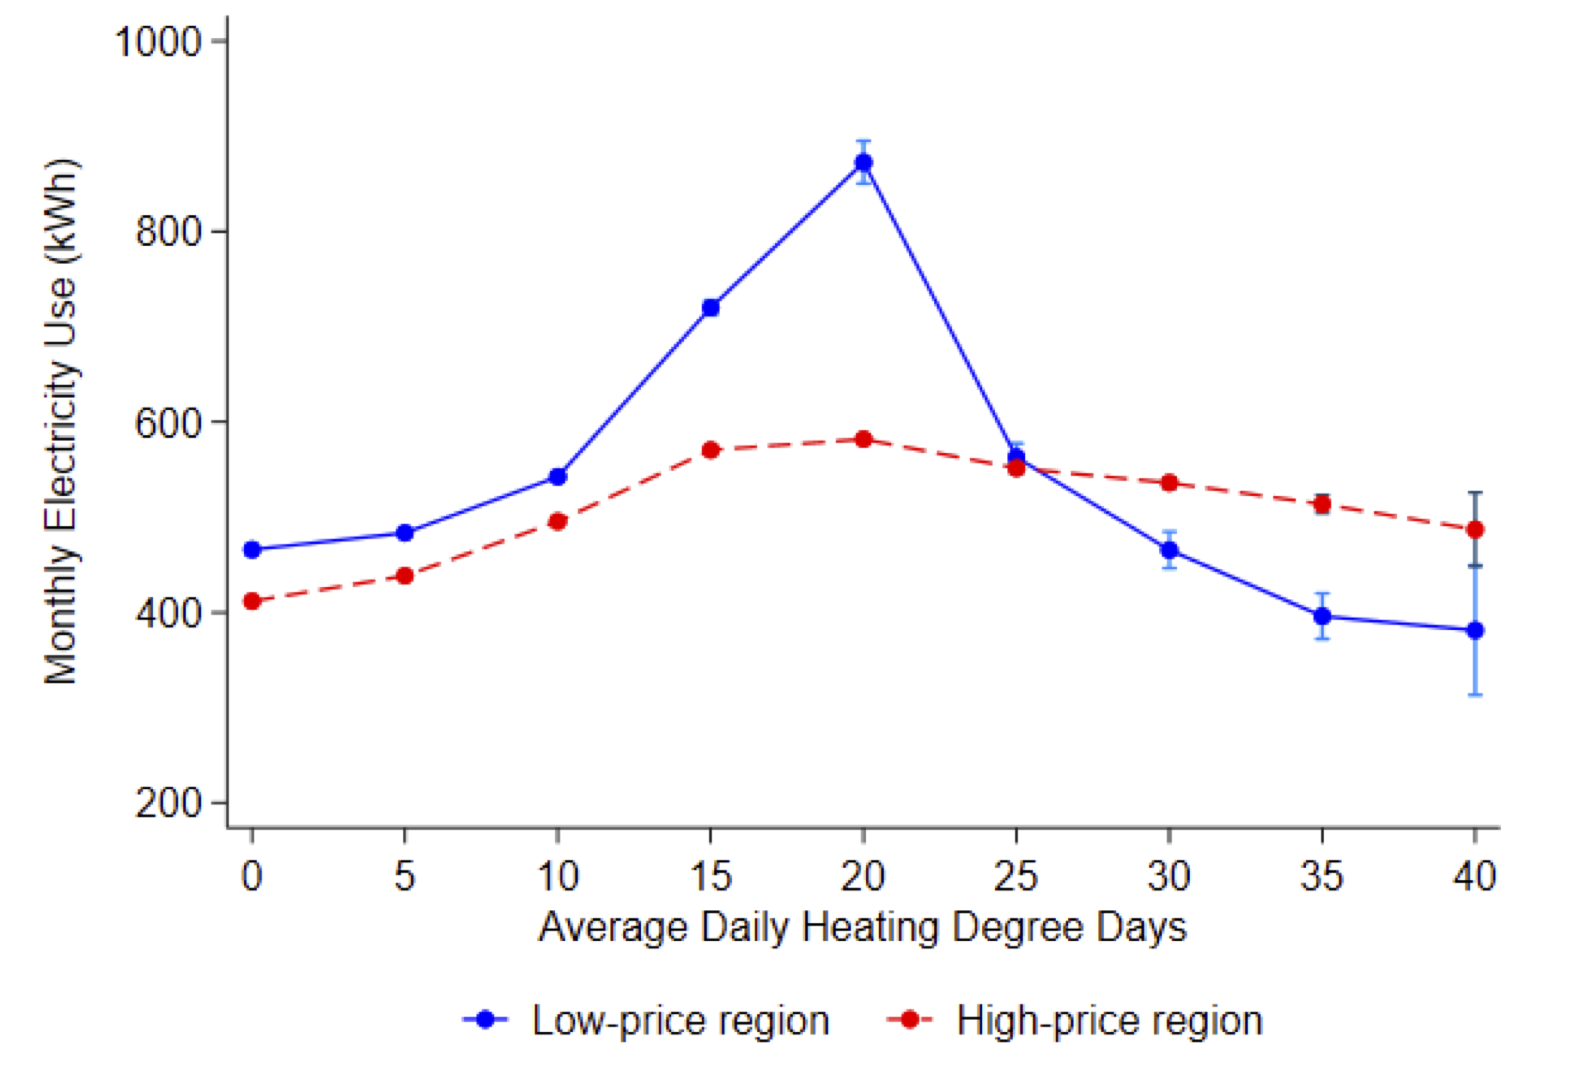
In areas that don’t get very cold (at least by my Canadian standards), this graph suggests that households facing higher electricity prices (red line) are investing in more efficient heating appliances and/or have developed the habit of putting on an extra sweater. Beyond 20 HDDs, the patterns are more confusing. The drop in electricity consumption as climates get colder could be partly explained by heating fuel choices. Lucas has a cool paper on home heating fuel choices which finds that households facing higher electricity prices and colder climates are less likely to heat with electricity.
California’s high prices will slow progress on electrification
Throughout this blog, I’ve been referring to the “low” and “high” price sides of pricing territory borders. But it would be more accurate to refer to these prices as “too high” and “even higher”. Retail electricity prices in California– across all climate zones – are much higher than the social marginal cost of electricity consumption because California uses retail electricity prices to raise needed revenues for power system infrastructure, wildfire adaptation, public purpose programs, etc.
Jesse’s paper shows us how high retail electricity prices have impacted household electricity consumption. Impacts over the long run are surprisingly large. Going forward, these too-high prices will discourage investments in electric cars, electric space heating, and electric water heaters. This is bad news in a state where residential sector electrification is at the core of our decarbonization strategy.
If you’re still reading this blog, you must be interested in/have questions about this new research. You are officially invited to Jesse’s Energy Institute webinar this Wednesday where he will be presenting his research and taking your questions. I’ll see you there!
Keep up with Energy Institute blog posts, research, and events on Twitter @energyathaas.
Suggested citation: Meredith Fowlie, “Who (Besides the EI Blog) Pays Attention to Electricity Prices?”, Energy Institute Blog, UC Berkeley, October 17, 2022, https://energyathaas.wordpress.com/2022/10/17/who-besides-the-ei-blog-pays-attention-to-electricity-prices/
Categories

Meredith, I can’t help but notice how every option and strategy you consider occurs within a 1970s-era, fossil fuel-dependent, cost-of-service electricity framework. It’s one where energy consumption has costly climate impacts and will always have them; where it’s customers’ responsibility to use less of it to prevent those impacts, and make sure there’s enough of it to go around.
Of course that forces low-income consumers to bear most of the burden. Those living in apartments without solar panels or Power-Wall batteries must pay to cross-subsidize transmission, administrative, and fuel costs.
And now California has arrived at a point where adding more solar won’t even help. Between 9AM – 3PM, virtually every day of the year, we have too much solar electricity and have to get rid of it. During that period either other states are paid to take the excess (“negative pricing”) or solar farms are paid to generate no electricity at all (“curtailment”). These costs are billed to customers, for which they receive nothing of value in return (other than preventing solar from destroying our grid).
True, we can turn off our A/Cs, and swelter in the heat when electricity prices go up. Or, we can invest in more efficient A/C, even if our inefficient unit works just fine. Or, we could demand our utilities invest in nuclear electricity and use as much as we need, want, or can afford, guilt-free.
Instead of punishing consumers for energy inefficiency or excessive consumption, we could allow them to use A/C at their discretion – there’s no environmental impact either way. So what are we waiting for?
Carl, and why does every option and strategy you propose revolve around the 1950s-era nuclear-dependent “to cheap to meter” electricity framework? If everyone has free AC, how do you propose to pay for the grid capacity and the load following resources that are necessary to ship our “cheap” nuclear power that will likely cost more than 10 cents/kWh on its own?
Richard, not the U.S. nor any other country was “nuclear-dependent” in the 1950s, unless you’re confusing nuclear energy with nuclear weapons.
It’s a common mistake, as is thinking a nuclear explosion can happen at a nuclear power plant. Nuclear weapon cores are >90% U-235, uranium’s most common fissile isotope, while nuclear power plant fuel contains less than 10% U-235. A nuclear explosion is thus impossible at a nuclear power plant, thanks to this safety- and anti-proliferation requirement adopted by the Atomic Energy Commission (AEC) half a century ago.
Regarding “to (sic) cheap to meter” – though anti-nuclear activists have reimagined AEC Commissioner Lewis Strauss’s 1954 comment as evidence of nuclear fisson’s failed promise, Strauss was referring to nuclear fusion, not fission. Because fusion would only require water for fuel, Strauss foresaw a future where the fuel cost of generating electricity would be insignificant.
Though fusion has thus far proven impractical, uranium is by far the cheapest, most energy-dense source of fuel for generating dispatchable electricity. The entire U.S. nuclear navy, with 11 aircraft carriers and 80 submarines, is powered for an entire year by 620 kilograms of U-235 – a cube one foot on each side.
“If everyone has free AC…”
What’s your source for that assumption?
“…how do you propose to pay for the grid capacity…”
I would have ratepayers pay for it the same way they did when electricity cost one-fifth* of what it does now.
“…and the load following resources…”
Modern Gen-3 nuclear plants have no problem following the gentle curves of customer demand. Unless you’re insisting on re-building nuclear plants of Chernobyl-vintage…I assume that isn’t the case!
“… that will likely cost more than 10 cents/kWh on its own?”
Here, I assume you’re referring to the wildly-inflated cost provided by the Center for Energy Efficiency and Renewable Technologies (CEERT) for generating electricity at Diablo Canyon. Without speculating about the motive for CEERT’s ridiculous cost estimate, I will note the undeniable conflict of interest that exists for CEERT Boardmember Jonathan M. Weisgall with his position as Vice President for Legislative and Regulatory Affairs at Berkshire Hathaway Energy (BHE). BHE subsidiary PacifiCorp stands to make $billions by replacing Diablo Canyon with electricity from its Wyoming coal plants (transmission to connect them to Southern California is already under construction).
Per PG&E’s 2021 FERC Form 1 filing, the cost of generating electricity at Diablo Canyon is 3.6 cents/kWh – and with capital costs 100% paid off by 2026, consumer rates will be considerably lower than they are now.
*2020 dollars
The infamous quote from AEC Chair Lewis Strauss in 1954… That makes unmetered nuclear power a 1950s solution.
There are many other estimates besides CEERT that calculate the cost of generation at Diablo Canyon. Including capital cost recovery, its currently about 8 cents/kWh according the PG&E’s 2023 GRC workpapers. And you’re behind the times because SB 846 that extends the life of DCPP pushes the variable cost to nearly 6 cents/kWh. And as has been posted repeatedly here, nuclear power plants are costing in excess of 10 cents/kWh to construct and run.
Either you use less, or you generate your own power at a fixed price. Today’s Solar panels pro rate over their lifetime in electrical output about 10 cents per kilo watt hour. Replacing 30 cent per kilo watt hour utility energy with homemade solar energy, that costs 10 cents, is the right way to go. Battery storage along with solar panels averages 22 cents per kilo watt hour over the lifetimes of the systems with one 25-year solar panel system and 2 consecutive battery installations of 12.5 years each. Unless one has multiple electrical utility outages a year, batteries are an unnecessary additional cost and other forms of back up electricity, such as an Uninterruptable Power supply (UPS) or generator would have a better payback over time. Peak times are evening hours when everyone gets home from work and every home appliance and air conditioning gets powered on. It is also the time solar panels are powering down and off. I you have a large enough solar panel system, that produces more energy than you need, your compensation for two kilo watt hours during the midday period will buy back one hour of peak time power you buy from the utility. A fair trade when you consider one is using the utility grid as their battery and do not need to buy batteries at all to stay powered. Utilities are building battery systems to level out the usage demand and supply so let them make the investment, and not the homeowners, in microgrid battery installations.
The problem with the law of suppy and demand economics is you don’t know if the cutting back because of cost of electricity creates suffering or efficiency in the consumer.
I found this article to be illuminating. One of my take-aways was that higher prices reduce demand.
It seems, though, that there was one thing left out. Renters and consumers without substantial resources are unable to install devices that would reduce demand by being more efficient or generating energy (solar panels).
But then, reducing the demand reduces utility income, requiring utilities to raise their rates to maintain their P/E ratio. Which would cause consumers to tighten their belt a bit more and further reduce demand requiring another rate increase …
Another method of comparing elasticity of electrical rates might be to compare use in similar neighborhoods next to each other but served by different utilities with different rates. Both Sacramento Utilities District (SMUD) and Alameda have significantly lower electricity rates than PG&E. See: https://www.smud.org/en/Rate-Information/Residential-rates and https://www.energysage.com/local-data/electricity-cost/ca/alameda-county/alameda/#:~:text=Electric%20rates%20in%20Alameda%2C%20CA,-The%20easiest%20way&text=The%20average%20residential%20electricity%20rate,rate%20of%2018%20%C2%A2%2FkWh.
It is surprising that electricity demand responds to price as much as it does. In my experience most consumers have no idea what rate they pay for electric and gas rates, and only know what their combined monthly bill is. I am reminded of a hardware salesperson laughing over the fact that in winter people upset at gas heating bills would come in asking for energy efficient light bulbs. Few consumers seem to know how their rates increase with increased use. Would an education system explaining the cost of electricity and how it increases per kwh with increasing use make consumers more aware of how their appliance use increases their monthly cost?
But don’t expect utilities, that make money by selling more electricity, to give free hand outs on how to be more energy efficient and save money. They did that with CFL lighting but no longer do it with LED lighting. The higher PG&E prices just in themselves, moved more Californians to get Solar panels, and so the public, that can make a difference, is doing so if they have the Finanancial means to do so. Utilities are selling less power now than they did in 1982 thanks to energy efficient lighting and appliances. The public has responded to inefficiency and waste and demand is down across the board. The infrastructure carves out on electricity in 1982 was 42% and 58% for the cost of generation. Today the infrastructure carve out is 74% and energy generation is 26%. Less energy sold, the less produced but the infrastructure costs stay the same except for inflation and labor costs that always are going up. Electric Vehicles will be the salvation for the utilities because there demand on the grid will increase generation and decrease the overhead portion of the bill. Use more and pay less per kilo watt hour overall. Rooftop Solar is the salvation for the homeowners today over high utility prices.
“But don’t expect utilities, that make money by selling more electricity, to give free hand outs on how to be more energy efficient and save money.”
California utilities aren’t premitted to earn a profit on the sales of electricity, a prohibition with its origins in the early 1980s, that was enacted to achieve the very goals you describe – to improve energy efficiency and reduce consumption. Since, various schemes have been introduced to allow utilities some measure of profit, with varying degrees of success.
“Utilities are selling less power now than they did in 1982 thanks to energy efficient lighting and appliances.
In 1982 U.S. utilities sold 2,244 TWh of electricity:
https://www.eia.gov/totalenergy/data/annual/showtext.php?t=ptb0802a
in 2021 they sold 4,120 TWh:
https://www.eia.gov/energyexplained/electricity/electricity-in-the-us-generation-capacity-and-sales.php
In 2021, U.S. utilities sold 84% more electricity than they did in 1982.