Market Integration and Renewable Energy
New research explores the economic benefits of recent transmission investments in Chile.
Total installed solar capacity in Chile now exceeds a whopping 4.4 GW. That’s 20% of all the installed solar in Latin America, despite Chile having less than 3% of the region’s population.
In a previous post, I gave four reasons why Chile is such an attractive market for solar: (1) rising electricity demand, (2) world-class solar resources, (3) limited natural gas and coal, and (4) commitment to the free market.
Today I want to add a fifth reason – (5) a robust transmission network. A terrific new paper by Luis Gonzales, Energy Institute alum Koichiro Ito, and Mar Reguant examines the short- and long-run impacts of recent transmission investments in the Chilean electricity market, documenting large economic benefits.
Golden Link
The Atacama Desert in Northern Chile is high, flat, and bone dry — the ideal location for solar. By some measures, the Atacama is the driest place on the planet. Some parts of the desert have never seen a drop of rain in 400+ years. The sun beats down day after day with some of the highest levels of solar irradiance anywhere in the world.
World-class solar resources are available throughout the Atacama, stretching 1000 kilometers from 18 degrees south latitude in the north to 29 degrees south latitude in the south. The challenge is, however, that not many people live that far north. The mining industry is in the north, but most of Chile’s population and thus, most of the demand for electricity, is found 1000 kilometers further to the south around Santiago at 34 degrees latitude.
One option would be to build solar close to Santiago. The problem is that solar irradiance around Santiago is at least 20% lower, significantly reducing the value of the investment. It’s often the case with renewables that the best resources are not located where electricity is most valuable.
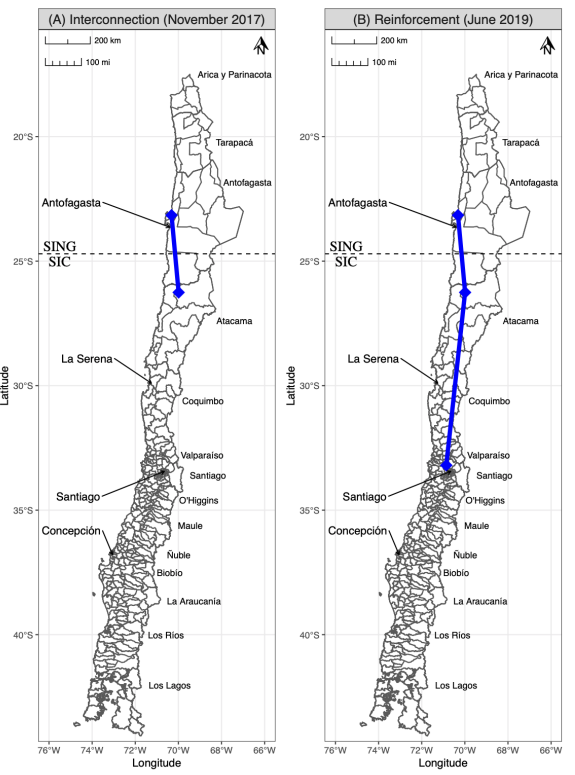
Until 2017, Chile’s northern (SING) and central (SIC) electricity grids were completely separated with no interconnection between them. As shown in the maps below, the Chilean government completed a new interconnection in November 2017, and a reinforcement transmission line in June 2019. Both expansions were double circuit 500kV transmission lines with enough capacity to significantly integrate SING and SIC.
Price Convergence
The authors first examine the impact of market integration on wholesale electricity prices. The figure below plots the difference in wholesale electricity prices between Northern (SING) and Central (SIC). These prices are from noon to 1pm, but the paper also examines prices at other hours of the day.
Before integration, there were large price differences between regions. Between 2013 and 2015, prices were typically much lower in Northern Chile, with average differences often exceeding $100 per megawatt hour. Then, between 2016 and 2017, the supply-demand balance flipped, with consistently higher prices in Northern Chile. The paper provides additional details about the flip, but the main explanation is large growth in solar capacity just to the south of the interconnection in SIC. But the important broader point is that during the years that the regions were not connected, prices tended to be quite different.
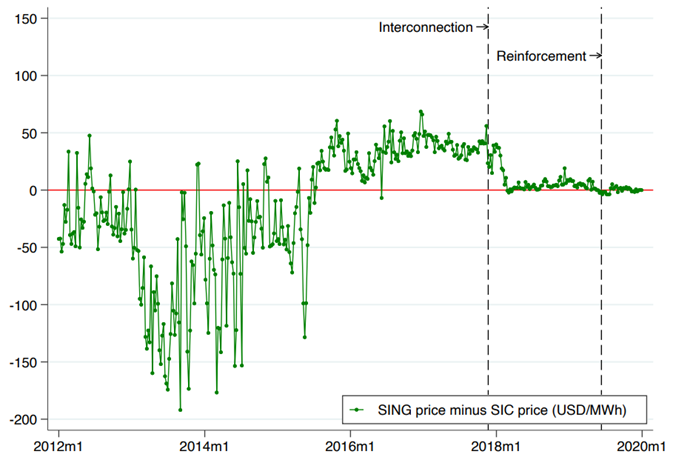
After integration, the price differences go to nearly zero. Week after week, electricity was shipped along the new transmission line to whichever location had the highest value for it. This is how free trade works. When I have excess, I sell to you. When you have excess, you sell to me. This is market efficiency! Smaller price differences mean this integrated market is finding lower-cost ways to meet demand.
Locational Patterns
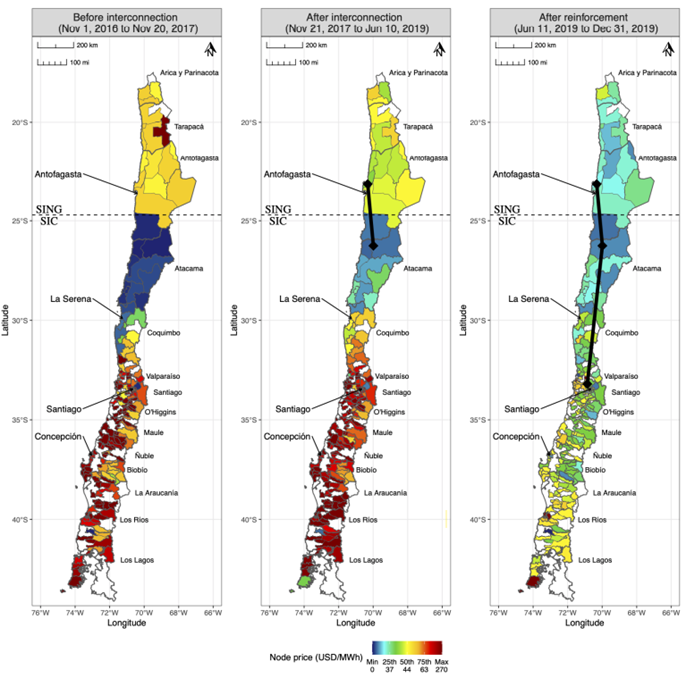
The locational patterns are interesting too. The maps below plot province-level average electricity prices between noon and 1pm for three time periods. Before interconnection, prices were low in the middle, medium in the North, and high in the South. Interconnection significantly equalized prices above 30 degrees latitude, but it was not until reinforcement in 2019 that price uniformity more or less held for the entire country.
When the area around Santiago and Concepción goes from red to green, this is Northern solar generation finally being able to reach these important load centers. This means lower electricity bills for residential and non-residential customers, and less need to operate fossil-fuel-powered generation. Indeed, the authors show that along with price convergence, market integration led to higher levels of renewable generation, decreases in generation cost, and lower pollution emissions. Win-win-win!
I can’t help but to contrast this with Texas during February 2021. Grumpy economists have often argued that Texas could have a more reliable, cheaper, and greener electricity market if it would integrate with the rest of the United States. Just look at the Texas Power Crisis. At the same time that electricity prices in Texas were spiking to $9000 per MWh and millions of households were experiencing blackouts, wholesale prices in MISO and PJM were 20x lower. If Texas could have imported electricity from other states, you would not have seen these huge price differentials.
Longer-Run Impacts
Chile’s transmission investments were planned years in advance, and the authors find that renewables developers anticipated the integrated market and began increasing investment even before the transmission expansions occurred.
Estimating impacts on these investment margins is a big part of the contribution of their paper, and the authors build a structural model of power plant entry that allows them to say what the Chilean market would have looked like without these transmission investments. They find, for example, that the full dynamic impact was to increase total Chilean solar capacity by 51%. As the authors explain, “a substantial amount of renewable entry would not have occurred in the absence of market integration”.
Total Installed Solar Capacity in Chile

This study was made possible, in part, because of the availability of unusually rich data. Chile has long been committed to collecting and sharing detailed data about their electricity market. The authors were able to collect, for example, detailed hourly data on node-level market clearing prices. This type of detailed information enables innovative research and a better understanding of the market.
Integration = Value
The paper complements a broader growing literature on the importance of electricity transmission. In related work, for example, economists Harrison Fell, Dan Kaffine, and Kevin Novan examine transmission congestion in ERCOT and MISO, finding large environmental benefits from increased transmission.
The big takeaway from this growing literature is that transmission expansions can create significant economic value. Yes, electricity transmission is expensive and challenging to build. But these estimates of economic and environmental benefits can be compared to investment costs to help guide when and where to build new transmission.

Keep up with Energy Institute blogs, research, and events on Twitter @energyathaas.
Suggested citation: Davis, Lucas. “Market Integration and Renewable Energy” Energy Institute Blog, UC Berkeley, July 11, 2022, https://energyathaas.wordpress.com/2022/07/11/market-integration-and-renewable-energy/
Categories
Lucas Davis View All
Lucas Davis is the Jeffrey A. Jacobs Distinguished Professor in Business and Technology at the Haas School of Business at the University of California, Berkeley. He is a Faculty Affiliate at the Energy Institute at Haas, a coeditor at the American Economic Journal: Economic Policy, and a Research Associate at the National Bureau of Economic Research. He received a BA from Amherst College and a PhD in Economics from the University of Wisconsin. His research focuses on energy and environmental markets, and in particular, on electricity and natural gas regulation, pricing in competitive and non-competitive markets, and the economic and business impacts of environmental policy.

Great analysis, thanks Lucas for naming Chile. i would like to add another factor for the successful energetic transition in Chile, which is the market competitiveness enhanced through good policy, among some of the important ones:
1) Centralized and open international bidding processes for the regulated demand, long term contracts.
2) Open access to transmission (not perfect, of course)
3) Transmission costs are transferred to clients.
4) Equal treatment to international firms.
It’s an interesting article Lucas, with some stark findings. However, what about the long term? A transmission line is a way to arbitrage differences in irradiance; if the sunshine in the south of Chile were the same as the sunshine in the north of Chile (absent of weather differences such as being cloudy at different times, or space nad laand-use constraints), then the solar generators would be in the south close to demand and there would be little need for a long transmission line.
The difference in irradiance of 20% you note is a permanent feature in Chile, but the cost consequence associated with it is not. If my understanding of the cost equation is correct (and I must admit that finding explanations of this that are economist-simple are a challenge), the cost of solar generation is in proportion to the amount of sunlight, so 20% more sunlight, roughly 20% lower costs. If this is true, and the cost of solar generation in the south of Chile is, say $10 per MWh on average over the life of the plant, then it’s roughly $8 in the north. If the transmission line is amortised over its life to produce costs of $1 per MWh, then that’s $1 of arbitrage.
However, if the cost of solar generation falls, so that it’s only $4 per MWh in the south, if the 20% cost differential still holds, then that $3.20 in the north, or an arbitrage opportunity of only $0.80. If the transmission line still costs $1 than, although there will still be times due to weather differences, capacity constraints in the south etc that it can profitably operate, it becomes a lot more dicey as an arbitrage mechanism.
I know very little about economic regulation in Chile, including whether transmission lines are even regulated and, if they are, whether the regulator uses long asset lives or how strictly it controls depreciation patterns through the life of the asset. In Australia, which also has excellent solar resources which are a long way from sources of demand and a determined programme to develop these using transmission lines, the transmission lines are regulated, have asset lives of around 50 years and use straight line real depreciation (so the costs are indexed to give them the same real value through time) which means that the regulatory transmission price tends to stay reasonably constant through time, once maintenance for older assets and so on is taken into account. If the past history of solar is any guide, over 50 years, pretty substantial reductions in generation costs are likely, and arbitrage opportunities will become increasingly harder to find as time passes.
I have not read much on this longer-term picture for electricity transmission; whether it is a problem that other jurisdictions have solved, or even if it is considered to be a problem in need of a solution, but would be very interested to do so.
I don’t think that Texas 2021 is the right example to be looking at here.
Chile appears to be at an early stage of market integration, prior to which there were many periods of large price discrepancies. The figure in the blog implies a large power surplus in the North from 2012-2015, and a lot of benefit available. In 2016 and 2017, a more persistent but smaller surplus in the Central region; but basically consistent gains from trade in bulk power.
Texas 2021 was more a reliability issue, even though it lasted a full week. If you want to demonstrate the value of transmission to address that kind of problem you need a model that can show you bad years or months – not just typical ones – and an estimate of how frequently they occur. More important, you need to have a firm source of power at the other end. How firm is the power coming in from Northern Chile? Maybe solar in the Atacama is non-intermittent (no rain in 400 years?) – during the day. The Texas event went around the clock.
Re: “At the same time that electricity prices in Texas were spiking to $9000 per MWh and millions of households were experiencing blackouts, wholesale prices in MISO and PJM were 20x lower.”
20x lower would be $450/MWh. MISO and PJM had no power to spare. That price is an order of magnitude too high to be economic.
Bob Hargraves
This article demonstrates that a major value of transmission investment is to reduce energy prices in the receiving regions. And that the receiving regions, at different times, are different ends of the transmission lines. The fact that Southern Chile benefits most of the time, but Northern Chile also receives benefits, tells us that the cost of the new transmission should be spread to both region.
The important lesson is that the costs of transmission should be apportioned in proportion to benefit — that is, on a time-varying volumetric energy basis across the seasons and regions that benefit. Too often transmission costs are apportioned on a capacity basis ONLY to the peak period, meaning that only one receiving region pays all of the costs, because the flow happens to be in their direction during the peak period. The other region gets use of the line to reduce their energy costs at other hours, but pays none of the transmission cost. By assigning the transmission cost to all hours in which the line is used, to the receiving regions in each of those hours, we can more accurately introduce a cost-follows-benefits cost apportionment method. Peak hours, when the line provides both reliability benefits and energy cost savings, are more valuable, but any hour when the line provides energy cost savings have some value.
Often the cost of building a peaker is less than the cost of transmission to take advantage of excess capacity elsehwere, and on a pure-capacity basis, the receiving region will choose the peaker. But when the energy cost savings to both regions over the full 8,760 hours of the year are considered, the transmission interconnection is the better choice. But that choice will only be made if the transmission cost is shared across all hours when it provides economic benefit.
In Electric Cost Allocation for a New Era, we address the many dimensions of transmission cost allocation, including the apportionment of transmission costs on a time-differentiated volumetric basis. https://www.raponline.org/knowledge-center/electric-cost-allocation-new-era/