In 2022, both the US and Canada surpassed one percent of vehicles in operation (VIO) being electric vehicles (both BEVs and PHEVs) for the first time, according to new analysis and estimates from EVAdoption. (See VIO definition at the end of the article.)
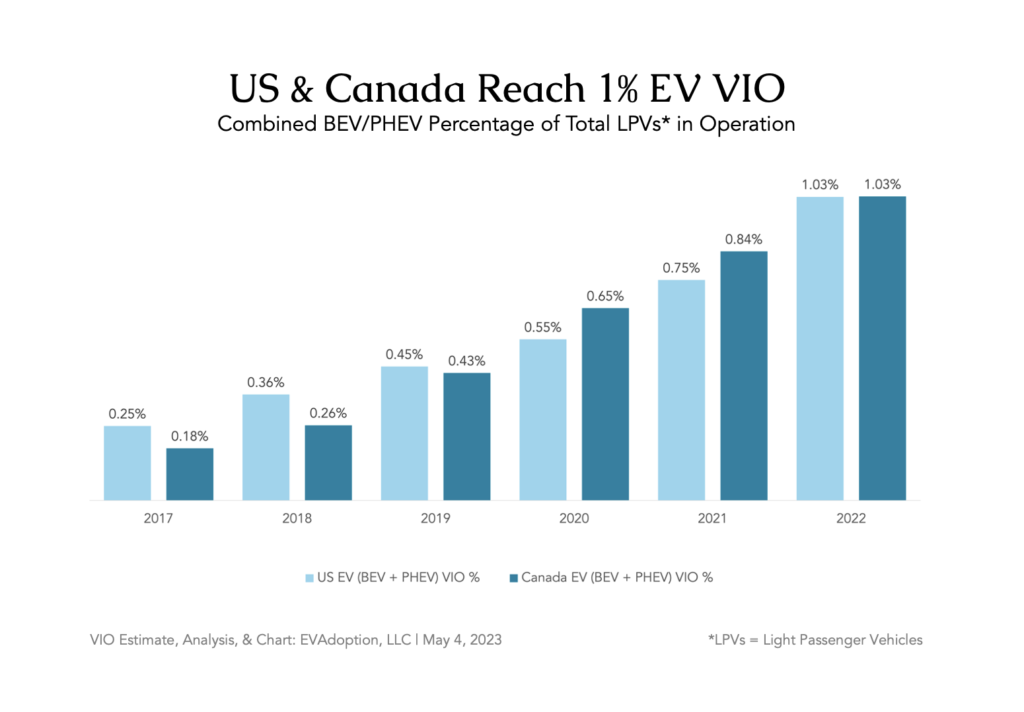
While this milestone of 1 out of every 100 vehicles on the road is either a BEV or PHEV in both North American countries is significant, it took five years to reach one percent VIO from 0.25% in the US and 0.18% in Canada in 2017.
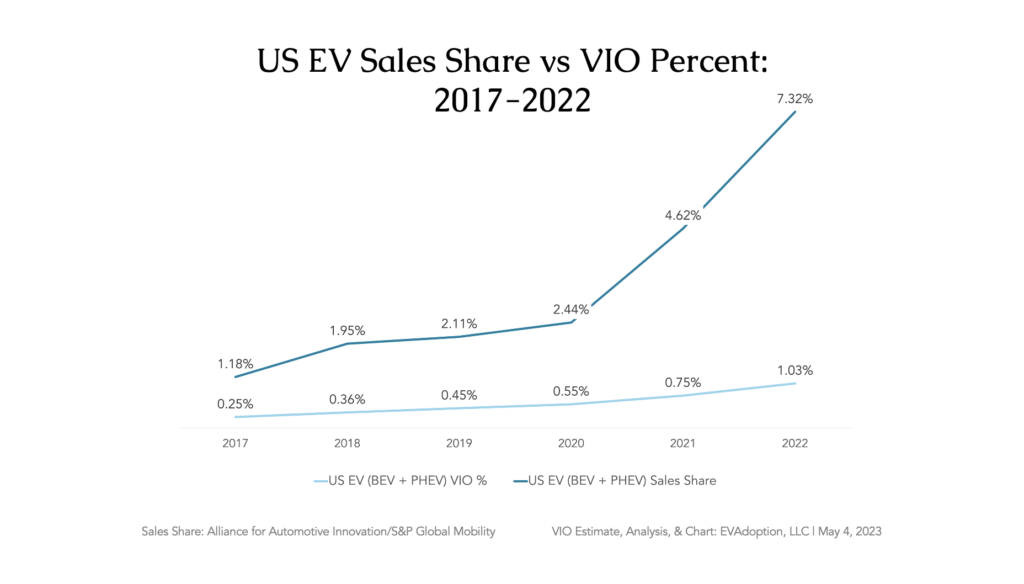
The chart below comparing EV sales share (the percent of new vehicle sales that are BEVs and PHEVs) to the VIO percentage shows that the new EV sales share increased nearly five percentage points in the last two years. This huge growth in new EV sales, however, resulted in only roughly 0.5 percentage point increase in the VIO percentage.
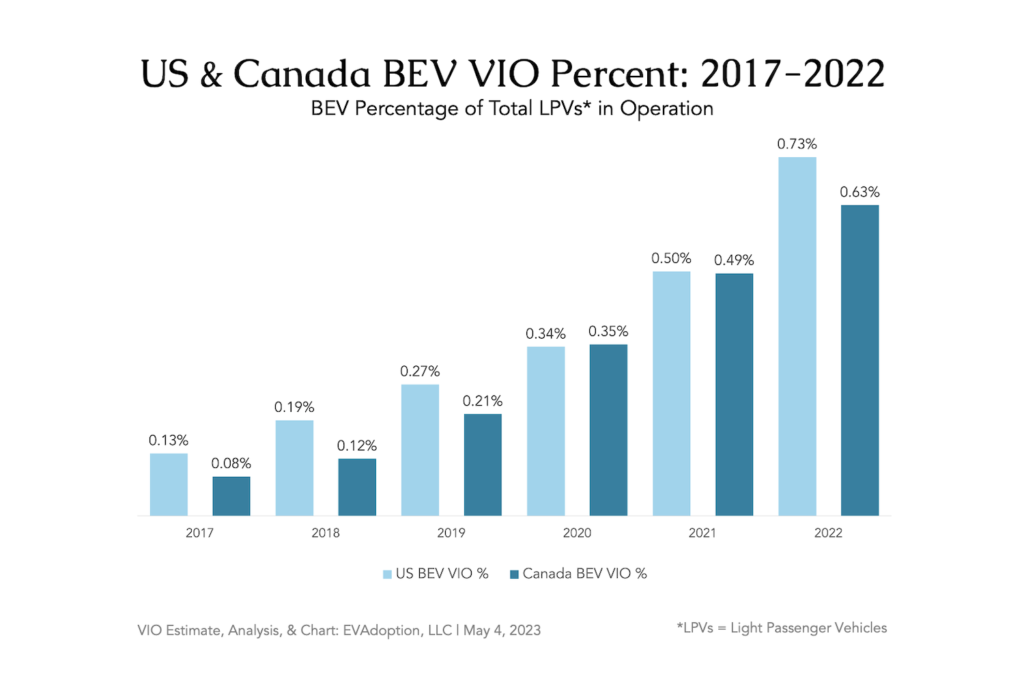
When looking at just BEV (full battery electric vehicles), the US jumped ahead of Canada by a modest 0.1 percentage points and reached 0.73%, versus 0.63% for Canada. The slight divergence is due to Canadians buying more PHEVs than the US since 2019. The difference is likely due to the immense popularity of the Tesla Model Y and Model 3 in California and other high EV-adopting states. While PHEVs being more popular in Canada is perhaps due to a combination of incentives, preferences, and colder winters versus mild winters in high-adopting western states in the US.
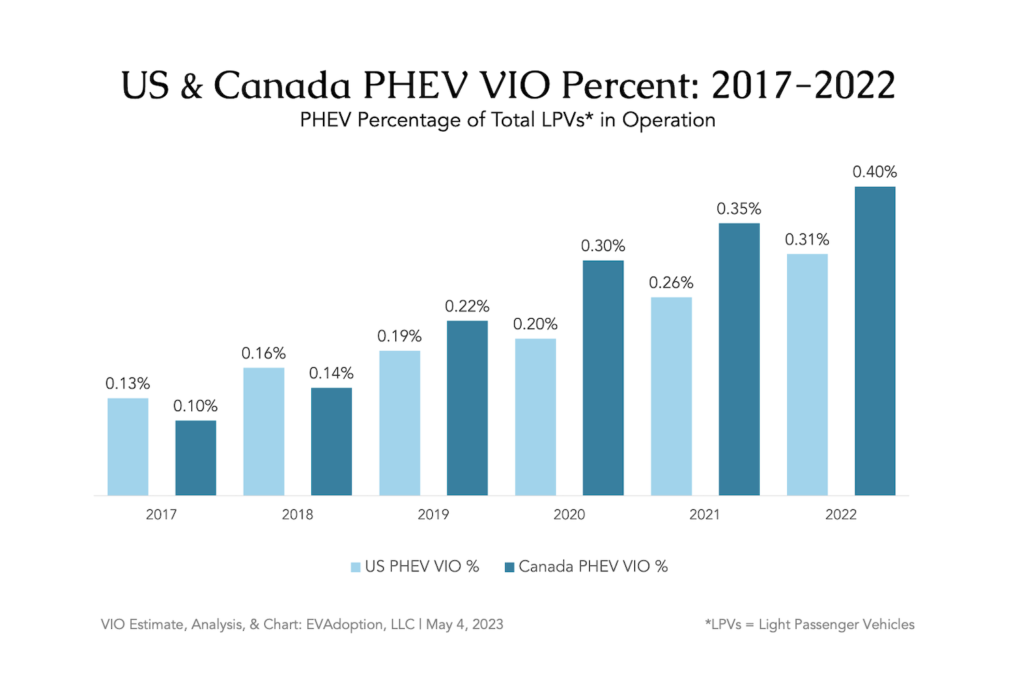
For PHEVs (plug-in hybrid electric vehicles), Canada stayed slightly ahead of the US PHEV VIO for the fourth straight year and reached 0.40%, versus 0.31% for the US.
EV Sales Share Versus Electric Vehicles in Operation
Like basketball superstar Stephen Curry of the Golden State Warriors, EV sales share — the percentage of EVs sold in a year as a percentage of total light passenger vehicles gets all of the headlines and buzz. And most government targets are EV sales share – based such as the US federal government is now targeting 67% EV sales share in 2032, or several states banning new sales of ICE vehicles — meaning 100% EV sales. Sales share is the key metric to understand the pace of new electric vehicle sales, consumer adoption, and targets of countries and states.
But EV VIO gets little attention like Curry’s teammate Kevon Looney, who quietly grabs rebounds, sets screens, and dishes out assists to Curry and his teammates. All of these targets and goals, however, ignore the actual number and mix of gas/diesel and electric vehicles on the road. When it comes to understanding the actual progress toward reducing tailpipe emissions and GHGs from transportation in a region, VIO is the metric that matters.
New EV sales are of course the key to changing the numerator in the VIO percentage calculation. A region can’t increase the EV VIO percentage unless new sales grow — or if the total number of vehicles in operation decreases (denominator). But the denominator — total light passenger vehicles in operation — continues to increase in the US and most markets.
Current trends and factors driving the total VIO include:
- The average age of vehicles continues to increase.
- Cars and trucks simply last longer.
- Cars and trucks getting more and more expensive, leading people to hold onto their vehicles longer or buy used ICE vehicles.
- Work from home and other trends lead to some households driving less and holding on to their existing cars longer.
Vehicles in Operation (VIO) Definition
Vehicles in operation, or “VIO,” is the estimate of the actual number of light passenger cars and trucks that are registered and “on the road.” VIO calculations take the existing VIO number for a year and subtract a percentage of vehicles that go out of operation (from crashes, mechanical failure, or being moved to another country), and then add the number of new vehicles registered for the current/most recent year. The EV, BEV, or PHEV VIO percentage is calculated by dividing the estimated number of those EVs, BEVs, or PHEVs in operation by the estimate of total light passenger vehicles in operation.
