Cars, Trucks and Buses or Power Plants?
Lowering pollution exposure of disadvantaged California communities.
Economists are (perceived to be) notoriously annoying in conversations. The first question that often comes out of our big mouths is “what is the objective of your policy proposal?” When we teach our gospel, we have often focused on efficiency, which essentially means maximizing the size of the birthday cake, given the ingredients available to you (or getting the most bang for your buck). Recently, and much too late, we have started paying more attention to equity implications of policies, which means who should get what size slice of the birthday cake. In the past we often just deferred to philosophers on that subject. But laziness has never improved anything other than a Sunday afternoon.
In California regulators have made some progress on this along a number of dimensions. First off, they came up with a way to write down what a disadvantaged community is. Senate Bill 535 (De León) formally defined disadvantaged communities as the 25 percent highest scoring census tracts in CalEnviroScreen 3.0, where scores are based on two components representing exposure to pollutants and their effects and two components representing population characteristics (sensitive populations in terms of health status and age) and socioeconomic factors. This provides regulators (and nerds like me) with a powerful tool to examine changes in environmental quality, be they policy induced or not, by community “type”. Many moons ago — because my work pace makes snails look like they are moving at Sha’Carri Richardson speeds — the California Energy Commission provided support to ask an interesting “what if” question and the final report was just published.
Where the pollution goes
The question we ask in this report is “what would happen to local air pollution in disadvantaged and non-disadvantaged (according to SB-535) communities if we ramp up electricity generation in the Western grid by 20%”. Why is this an interesting question? I would argue that electricity load is surely not going to decrease. Houses are getting bigger, cooling loads are getting bigger as a function of home size and ongoing climate change and finally, we are going to electrify many end uses in the, IMHO, correct quest to rapid decarbonization. You can look at the report for more details, but here is what we did.
- We assume the current mix of generation and use a standard econometric model to figure out which plants are dispatched at what level of system load. Yes, before you hit the comment button, this is a conservative approach. The grid will get cleaner over time, hence leading to a likely overstatement of our impacts. Please hold my quince kombucha while I continue.
- We assume a uniform 20% increase in load throughout the year by simply shifting up the system load curve. Yes, you can play with changing system load shapes if you want. Be my guest.
- We then look at what this does to the emissions of nitrogen oxides (NOx), sulfur oxide (SOx), and particulate matter (PM2.5) at each generating unit.
- We then take these emissions and feed them into inMAP, which is a fancy black box model, which transports emissions across space and then tells you what happens to ambient concentrations of pollutants everywhere as these things are blown around by wind and things of such nature.
- We then compare what happens to changes in ambient concentrations with and without the load increase in disadvantaged communities and non-disadvantaged communities.
Increases in pollution are not evenly shared
What do we learn?
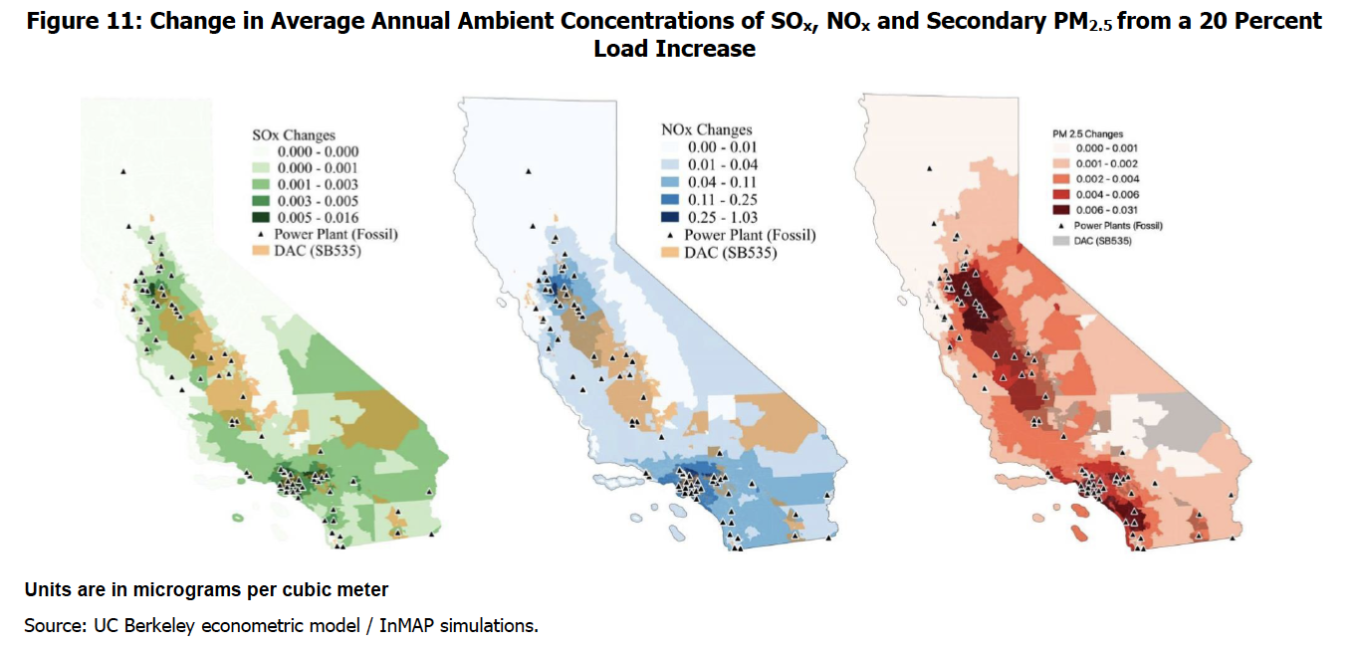
First, we learn that the changes in ambient concentrations vary quite significantly across space as shown in the figure just below. There are much bigger increases in the LA area and the northern Central Valley than in Coastal areas for example.
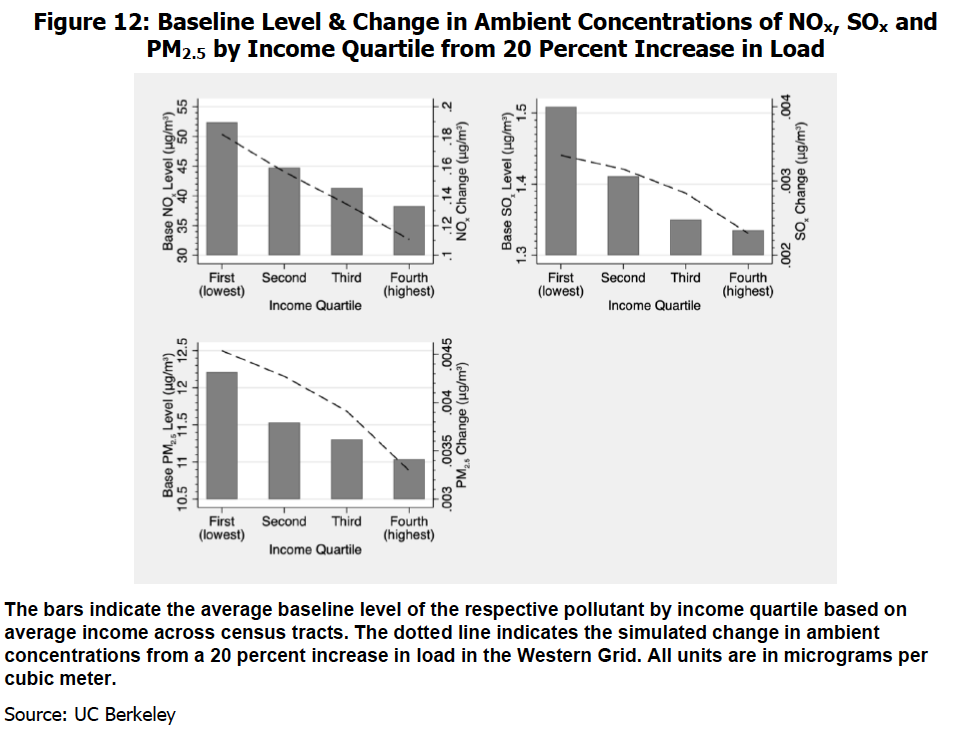
Second, we learn that if we attribute these changes by income level, high income people are going to experience smaller increases in air pollution relative to lower income people. The graph below shows this quite clearly. The bars show us the baseline ambient concentrations by income quartile and pollutants. Lower income areas have dirtier air to begin with. But the dashed line, which indicates the change in ambient concentrations follows this pattern, meaning that higher income communities pay a lower pollution penalty from the higher aggregate load than lower income communities, which exacerbates existing inequalities.
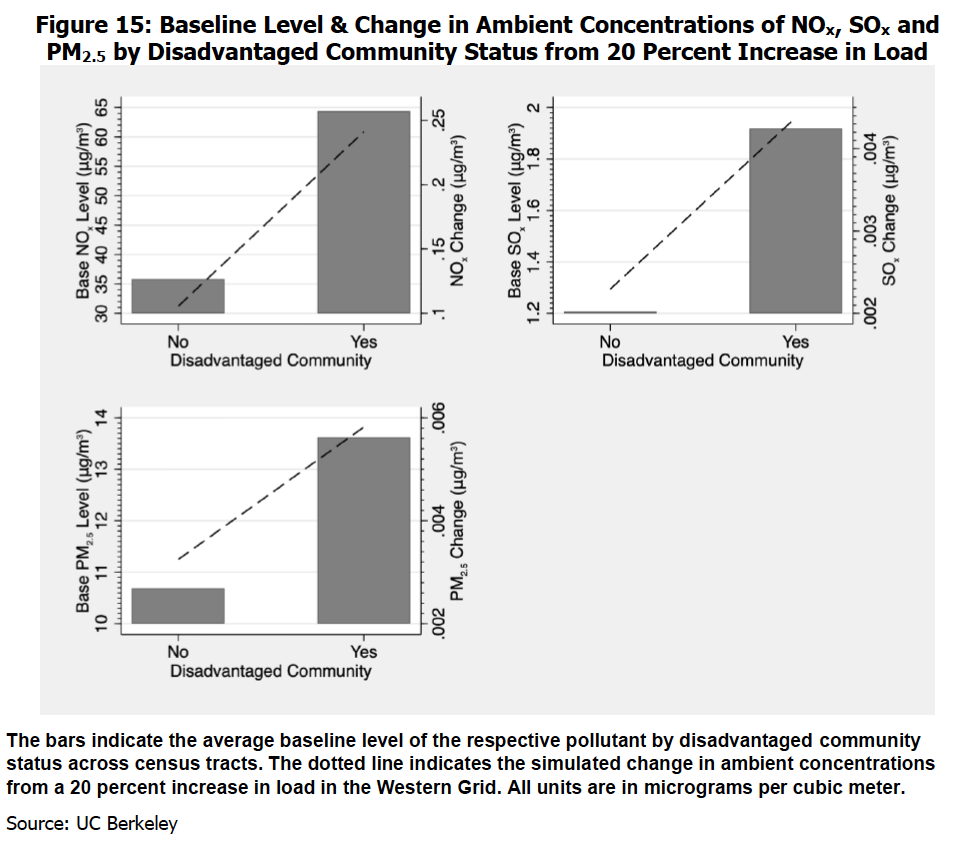
Income is just one dimension. The disadvantaged community status collapses multiple dimensions into a single indicator, and again we see this pattern. Disadvantaged communities have higher levels of baseline pollution for all three categories and are simulated to experience higher increases in pollution from a load increase.
Clean Smokestacks, Dirty Tailpipes
So Max, should we start protesting outside power plants and ask for them to shut down? Have we found the culprit? The answer to this question is not going to make me any new friends I am afraid. When we teach students about graphs, I always stress that we should look at units on the axes. A 20 percent increase in aggregate load is a massive increase in load. The corresponding increases in ambient concentrations are on average much less than 1 percent. This is due to the fact that many of the dirtier power plants supplying electricity to Californians are located outside of the state and are far away from these communities and people in general. Further, plants located inside California have pollution control equipment installed that removes a significant share of the pollutants from the smokestacks. And there are of courses many other sources of pollution that are not part of the electricity sector. So maybe massive investments in cleaning up fossil generation in California may not be the most effective strategy to improve local air quality in either type of community. I do of course fully acknowledge that the only way to get rid of carbon pollution is to stop burning fossil fuels, but this post is about local pollution.
So what should we do? As much as I like thinking about the electricity sector, I think the key to really ramping down pollution exposure in disadvantaged communities broadly has to be the transport sector. It is responsible for a significant share of the pollutants studied here as well as toxics and greenhouse gases – especially in driving happy California. So I am following some cool kids around who are studying this sector and am starting to learn a lot about cars, trucks and buses! We need to of course accelerate our understanding of the drivers of pollution exposure at the community level, but more importantly design, implement and enforce cost effective policies that will do away with the current unfair pollution exposure gap.
Keep up with Energy Institute blogs, research, and events on Twitter @energyathaas.
Suggested citation: Auffhammer, Maximilian. “Cars, Trucks and Buses or Power Plants?” Energy Institute Blog, UC Berkeley, August 2, 2021, https://energyathaas.wordpress.com/2021/08/02/cars-trucks-and-buses-or-power-plants/
Categories
Maximilian Auffhammer View All
Maximilian Auffhammer is the George Pardee Professor of International Sustainable Development at the University of California Berkeley. His fields of expertise are environmental and energy economics, with a specific focus on the impacts and regulation of climate change and air pollution.

The issues you’ve raised in this blog are very real. People usually hesitate to write on such topics but you did wonderful work. Keep it up!
The entire point of transportation and building electrification is to connect to a cleaned up set of generation resources both grid scale and distributed. Cranking up a production cost model without including the synergistic investment gives a very misleading result, which unfortunately can be picked up by the media and distorted with the headline “EVs will cause deaths in low income neighborhoods.” The reason California is going from 33% to 60% renewables over the next decade (almost certainly higher) is precisely for this reason. Note that the RPS share automatically adjusts with load growth, so there would not necessarily be added renewables if the the load growth didn’t appear. Given that California loads have not risen since 2006 (and PG&E actually experienced a record decrease in 2019–BEFORE the pandemic), the only reason why metered loads are going to increase in the foreseeable future is due to electrification.
A better approach is to consider what the incremental resource additions will be over that time, importantly because we actually don’t know what the true load profile will be for added electric load. 40 years ago when TOU pricing was applied to agriculture loads, no one was expecting that the ag loads would actually invert with the lowest usage at midday and highest at midnight! There should be less focus on the precision of modeling small time increments and more on the accuracy on what resources will be meeting those added loads.
Economists have been badly remiss on ignoring equity and equality in their modeling. There’s more macro analysis showing that inequality actually hurts overall economic efficiency. Beyond such providing equality of opportunity (which would be a big step in and of itself!) we also need to consider the equity of how of us starts and has access to resources along the way. Much of this can be quantified but economists haven’t done a good job of figuring out to how meld the different variables into a cohesive result. Resorting to the efficiency argument and then hand waiving over equity is what I’m seeing mostly so far. The academic community needs to plunge into researching how to address this issue and to start priming students now about considering these multiple dimensions even if the answers haven’t yet been developed.
Hi – thank you for this valuable exploration. You included some assumptions on projected energy usage. I would have liked to see some projections based on changes in driving, not just cleaning up the fuel but what could happen if vehicle miles traveled were significantly reduced. This has implications for urban planning.