US Auto Industry Down 8% Since 2019
It’s time for another one of our quarterly US auto sales reports. No other media outlet compares US auto industry trends with as much history and depth as we do in these. First, before getting into the automaker comparisons for the second quarter of 2023 versus the second quarters of 2019, 2020, 2021, and 2022, note that I just published our US EV sales report for Q2 2023 as well, and combining core data from that report and this one, it turns out that full electric vehicles (BEVs) accounted for 7% of US auto sales last quarter. That’s on the back of growing Tesla sales (which we’ll talk about more here) as well as growing EV sales from a handful of legacy automakers.
I’ll start with the giant overview chart first. The big picture view from this chart is that many automakers saw their sales drop a lot from 2019 to 2020 amidst the COVID-related economic shutdowns, bounced back a lot in 2021, but have since declined and are well below their Q2 2019 numbers. That said, there are some who have bucked the trend, including Ford right at the top of the sales chart, which has seen its sales climb from 2020 to 2021 to 2022 to 2023. No other automaker has seen consistent (perhaps slow, but consistent) sales growth from 2020 onward except for EV star Tesla and Chrysler (yes, Chrysler). One could consider this great news for Ford, but part of the reason for this is that Ford didn’t have as big of a post-COVID bounce-back in Q2 2021 as other automakers had.

Just looking at the leaders in the second quarter of this year, you can see that Ford, Toyota, and Chevrolet are in a tight race for first place, and especially those first two. Honda is on its own tier in between those three and Nissan. Most notable for the electric vehicle revolution is that Tesla is in the top 10, but not near the level of the big dogs (yet) — it’s down in 9th.

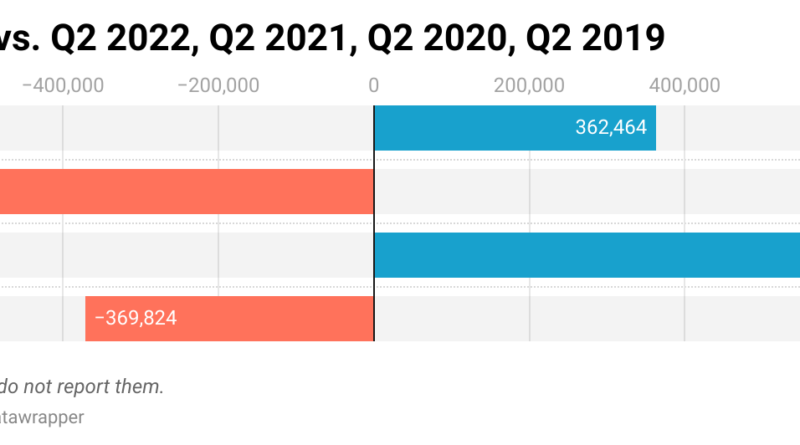
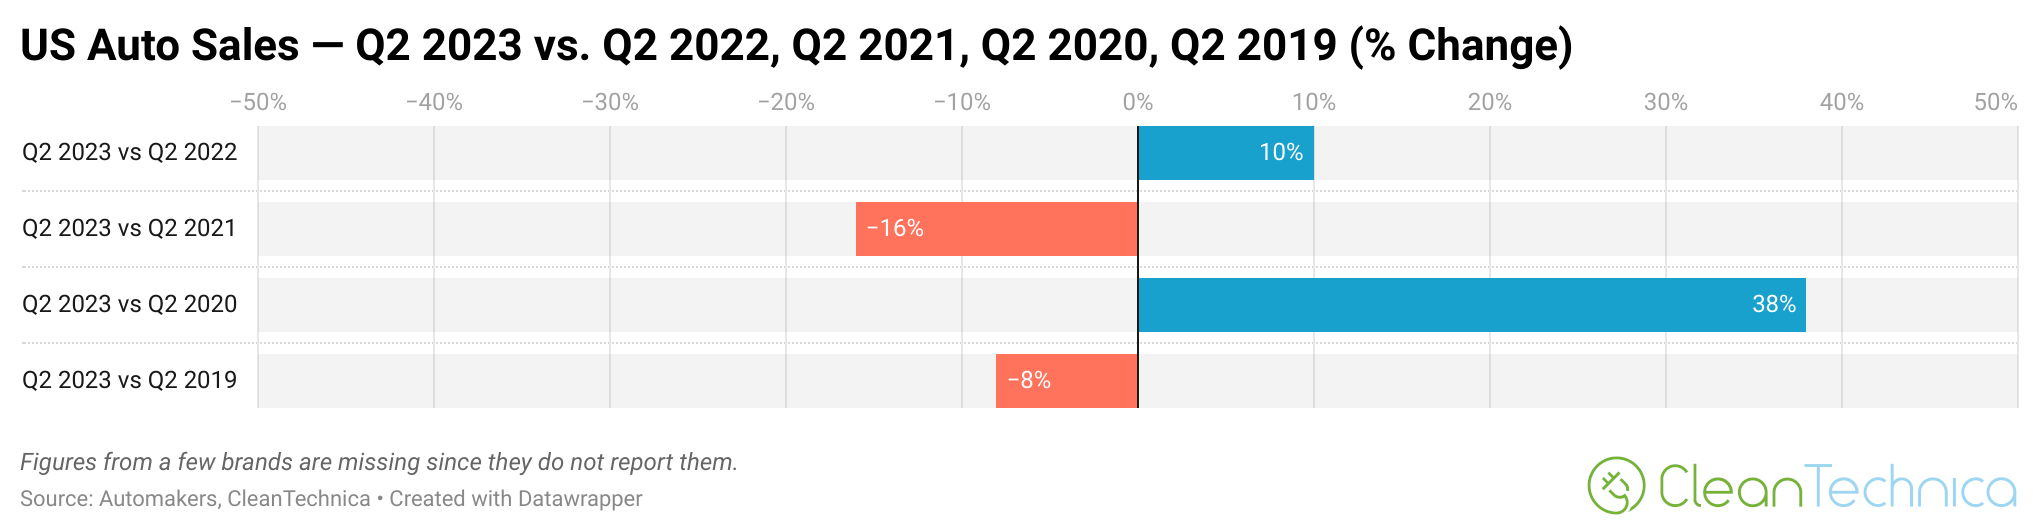
Looking at how the overall auto market has changed in the past four years, it’s been a bit of a bouncy ride. As you can see below, 2019 sales were well above 2023 sales (the first chart below shows that Q2 2023 sales were nearly 370,000 units lower than Q2 2019 sales). Then, 2020 brought the COVID pandemic and car sales collapsed — Q2 2023 sales were more than 1.1 million units higher than Q2 2020 sales. Naturally, Q2 2021 saw a big bounce-back in sales — Q2 2023 sales pale in comparison, ending more than 786,000 units below Q2 2021 sales. Are we getting to a more “normal,” stable period again? Maybe, maybe not. We’ll see what happens. The EV revolution is just getting underway, after all, and we don’t know yet how that will affect overall sales. Plus, there are potentially more economic challenges around the corner. What we can say from the past year or so is that Q2 2023 auto sales were 360,000+ units higher than Q2 2022 sales, a 10% bump year over year.

Now this is where it really gets fun. In the remaining charts, you can look at automaker-specific changes in sales going back to Q2 2019.
Honda’s the big winner compared to Q2 2022, but Chevrolet, Nissan, Tesla, and Ford all saw strong growth volume wise. Focusing on percentage growth, small EV startups Rivian and Lucid rose to the top — on the back of a very small number of sales in 2022.


Looking back two years, Tesla has seen the most sales growth, up more than 88,000 units (106%). Ford and Chrysler are also celebrating again.


Funny enough, Toyota was doing so badly in Q2 2020 that its sales rose the most, volume wise, for this time period. Tesla, second in the chart for this metric, was first when it came to percentage change, up a whopping 431%! Perhaps more surprising, Chrysler was up 255%! Mitsubishi also saw a surprisingly big boost relatively speaking. Getting back to volume or unit growth, just behind Toyota and Tesla were Chrysler, Ford, and then Kia.


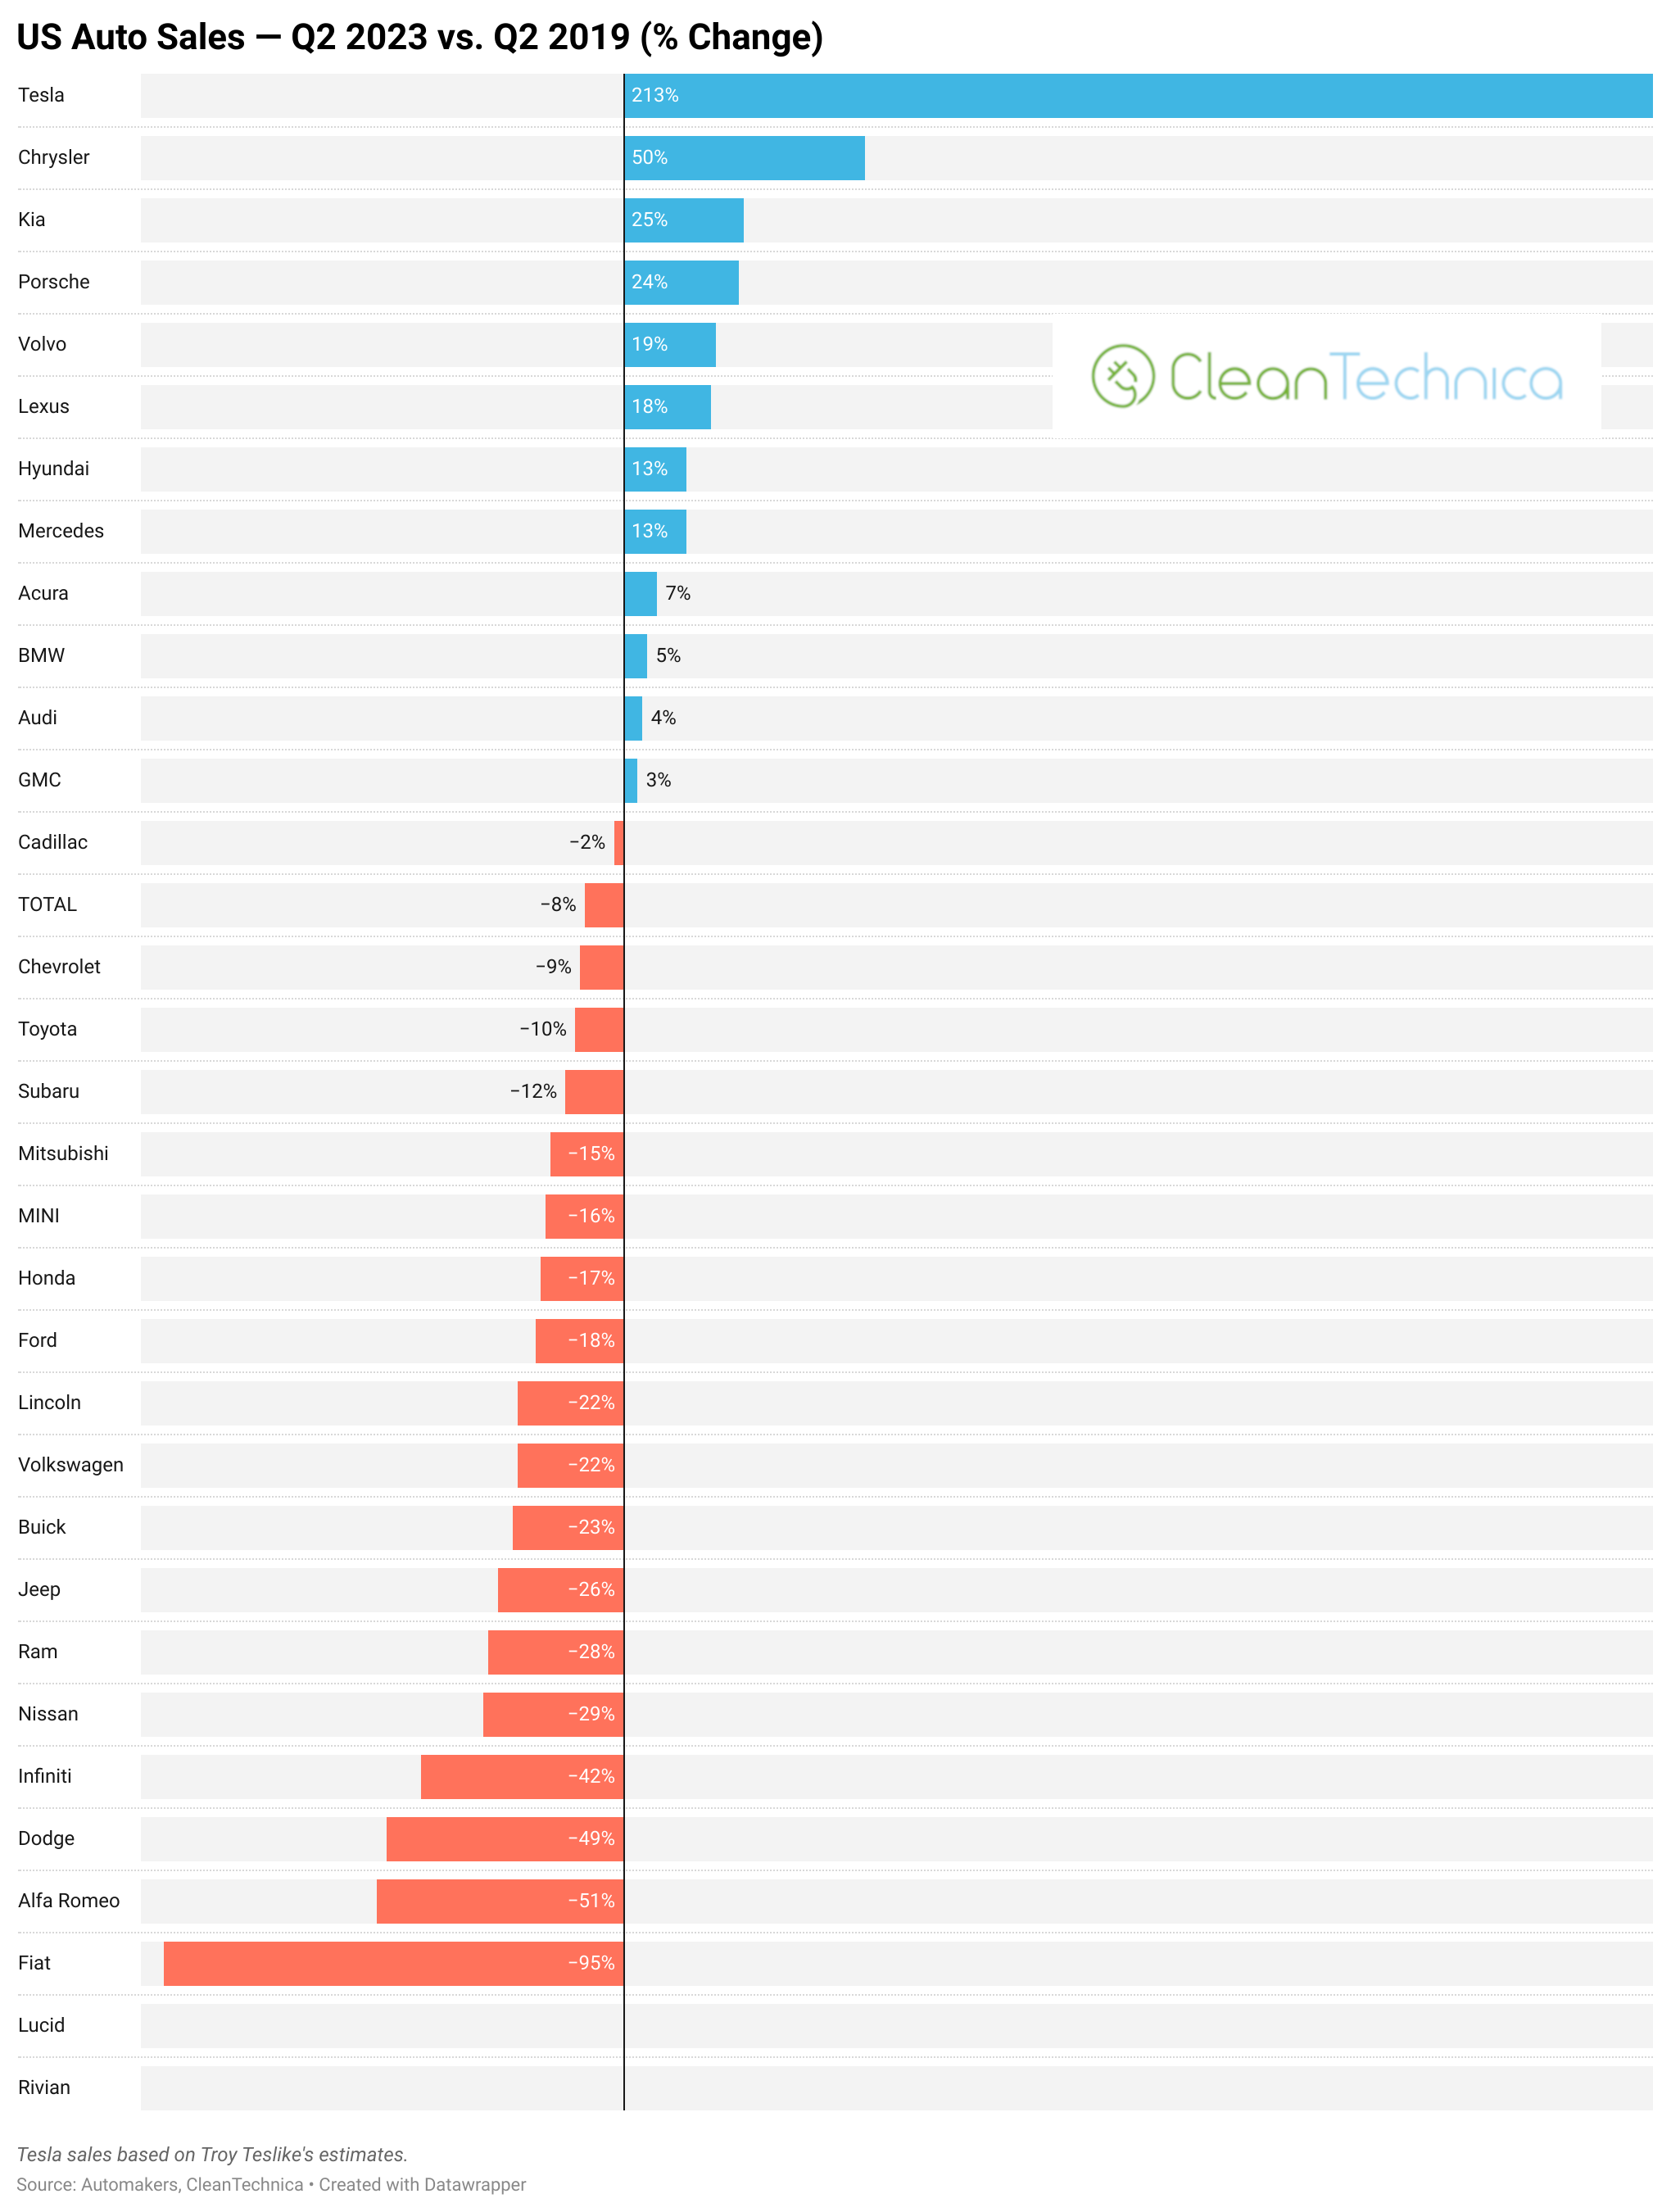
If we go all the way back to 2019, we can see that Tesla has had the most improvement in those four years, with sales increasing by 213%, or 116,000+ units — from 54,700 sales to 171,000 sales. Overall, the US auto industry declined 8% in that timeframe. More than half of auto brands saw their sales drop. If you remove Lucid and Rivian (since they weren’t delivering vehicles to customers in Q2 2019), 12 auto brands had an increase in sales in that timeframe and 18 auto brands saw a drop in sales.

That’s the story, but if you want to have more fun with that big chart at the top, an embedded version is below.
Also, if you have notes to add — or any questions — drop them into the comments below this article.
Have a tip for CleanTechnica? Want to advertise? Want to suggest a guest for our CleanTech Talk podcast? Contact us here.
Latest CleanTechnica.TV Video

CleanTechnica uses affiliate links. See our policy here.