On Inflation, Climate, and Compromise
Can the Inflation Reduction Act tackle climate change and inflation at the same time?
18 months ago, Larry Summers wrote an important piece in the Washington Post warning of two things. First, he cautioned that the Biden stimulus could “set off inflation pressures of a kind we have not seen in a generation”. Second, he worried that an overheated economy would make it hard to find “the political and economic space” to move the Democrats’ progressive agenda forward.
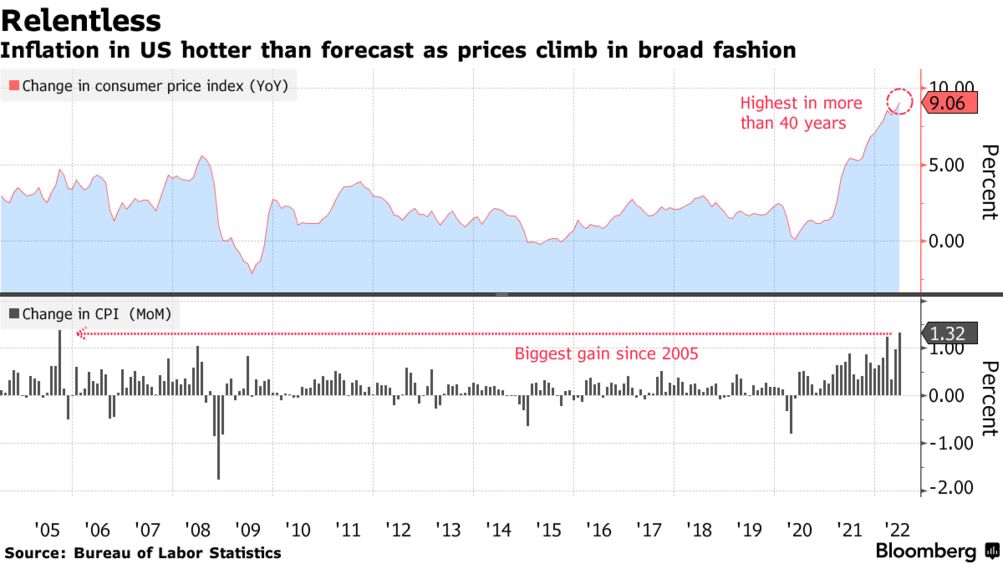
Three weeks ago, it looked like both of these projections were coming true. First, inflation numbers released on July 13 showed consumer prices increasing by 9.1%. This is the largest annual increase we’ve seen since 1981.
Source: Bloomberg
Then, after seeing these inflation numbers, Senator Manchin announced he could not support increased federal funding for climate and clean energy investments. His reason: “We cannot add any more fuel to this inflation fire.”
Senator Manchin is right to make fighting inflation a top policy priority. But declaring inflation public enemy number one does not take all federal climate policy options off the table. It does mean that we need to choose our policy instruments carefully.
Yesterday, after a whiplash week in Washington, Democrats in the Senate rallied to pass the Inflation Reduction Act (IRA). This bill includes the largest and most consequential climate and energy package ever to make it out of the U.S. Senate. This is not yet a done deal. I’m not ready to fully unpack this bill until it’s signed and sealed. So as we watch and wait, this week’s blog takes on the question: What does climate spending have to do with inflation fighting?
Energy prices are driving inflation (some more than others)
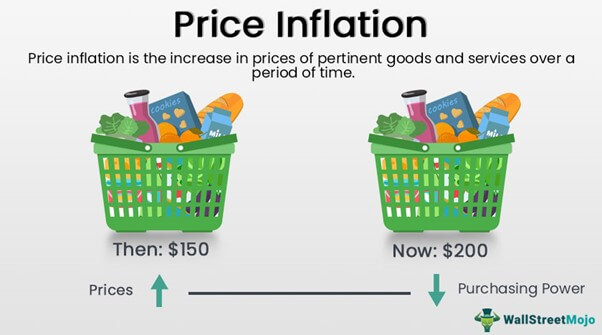
Before diving into the IRA details, it’s worth reviewing some inflation basics. Basically, households are impacted by inflation through the prices they pay for the stuff they consume. To measure and monitor the rate of inflation, nerdy economists track the cost of a bundle of goods and services (a.k.a. the consumer price index or CPI) that is representative of typical US household consumption.
Source: https://www.wallstreetmojo.com/price-inflation/
The key here is that the inflation rate, measured as the percentage change in the CPI, is determined not only by the prices we are paying but also by the mix of goods and services we are purchasing.
Energy prices have been playing an outsized role in driving the overall inflation rate we’re experiencing. To illustrate this point, the graph below plots the relationship between the “relative importance” of different consumption categories (a measure of how consumer expenditures are allocated), and the contribution to the rate of inflation we’ve seen over the past year. Energy expenditures (blue dot) account for less than 9% of consumer expenditures (comparable to car purchases and medical costs), but they’re responsible for more than 30% of inflation over the past year.

You’ve probably noticed that some of your energy costs (e.g., gasoline) have been rising faster than others (e.g., electricity). Breaking this energy consumption category into component parts, the impact of gasoline prices on inflation really jumps out.

One implication of these pictures: If more households were driving electric cars versus gas-powered cars, gasoline price shocks would have a smaller impact on US inflation overall because gas would account for a smaller share of household operating costs.
Another punchline: There’s more than one way to reign in these energy-related inflation drivers. We can try to reduce energy prices. And/or we can try to shift American households away from relatively high-priced energy sources. The Inflation Reduction Act (IRA) does some of both.
Climate action in the Inflation Reduction Act
Trying to keep up with what’s in and what’s out of the IRA has not been easy given the frenetic pace of the past few days. The graphic below breaks down the basic structure using the numbers reported here. The bar on the left represents tax revenues. The bar on the right represents government spending

The first thing to notice is that the IRA raises more revenues than it spends. This is the most critical inflation reduction driver in the IRA. I’ll leave it to the macroeconomists to project the net effects of this deficit reduction in detail. We’re energy economists over here. So I want to focus on the green parts which represent climate and energy-related provisions.
The energy and climate provisions fall into one of three categories:
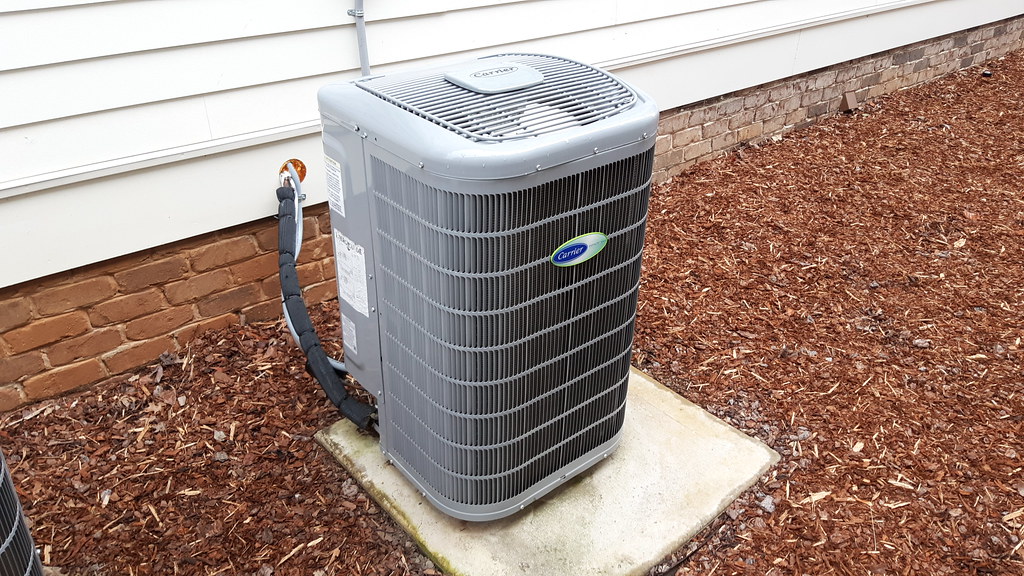
1. Consumer incentives: There are lots of provisions that will make it cheaper for households to electrify their lives. This includes $36 billion in tax credits for new and used “clean” cars. The IRA also directs billions of dollars in credits and rebates towards lowering the cost of purchasing heat pumps, electric water heaters, and other building electrification investments.
Source: Heat Pump
As I see it, the most promising path to deep decarbonization involves greening the grid and electrifying lots of stuff (including transportation and buildings). Thus, accelerating the pace of electrification is good for the climate. It could also help discipline inflation because as more households electrify, the “relative importance” of gasoline and natural gas prices will decrease. On the other hand, these demand-side subsidies could increase the price of electric cars and electricity. Which underscores the importance of supply-side measures…
2. Producer incentives: If we’re going to increase electricity demand (with accelerated electrification), we’ll need to increase electricity supply. The IRA allocates over $160 billion in clean energy tax credits over the next decade. The Act includes incentives for streamlining the permitting process and loans to grease the wheels of transmission projects. The IRA also includes measures to promote growth in domestic manufacturing of electric vehicles, battery supply chains, and other clean tech.
Bringing new renewable energy projects, new storage projects, and new transmission projects online will reduce wholesale electricity prices. But the impact on retail electricity prices will depend on how these investment costs are covered. We have blogged before about the efficiency and equity implications of using retail electricity rates to cover these capital investment costs. The IRA shifts a big chunk of this cost burden away from households and onto more progressive tax vehicles. In other words, tax credits offer a way to accelerate grid decarbonization without burdening electricity consumers with the capital costs.
3. A well-targeted tax: If you squint at my bar chart above, you can see a thin green line atop that revenues bar. This represents a judiciously targeted tax on an especially important greenhouse gas: methane.
Methane emissions are far more potent than CO2 in terms of warming potential (over the near term). And the majority of US methane emissions come from a small number of “super-leaks” which are typically caused by maintenance failures. The methane charge included in the IRA applies specifically to emissions in the oil and gas sector that exceed facility-specific thresholds. This provides a strong incentive for oil and gas producers to comply with EPA regulations. It’s a relatively small piece of the IRA. But it could have a relatively large impact on US GHG emissions.
Compromise and commitment (more needed)
The Inflation Reduction Act is a major shot in the arm for federal climate action. And it is structured in a way that should reduce consumer energy expenditures overall. The IRA is not anyone’s perfect policy package. But it’s nothing short of miraculous that Democratic lawmakers managed to thread this needle at a time when concerns about inflation loom large and rancor in Washington runs deep.
The climate measures contained in the IRA clearly have the potential to drive large GHG reductions. But realized economic and emissions impacts will depend to a significant extent on how the various programs are designed and implemented. In the weeks and months leading up to yesterday’s vote, we have seen (among other things) a refreshing display of collaboration, commitment, and compromise. Lots more of that will be needed to make the most of the opportunities that the IRA presents.
Keep up with Energy Institute blog posts, research, and events on Twitter @energyathaas.
Suggested citation: Fowlie, Meredith, “On Inflation, Climate, and Compromise,” Energy Institute Blog, UC Berkeley, August 8, 2022, https://energyathaas.wordpress.com/2022/08/08/on-inflation-climate-and-compromise/
Categories


 Source
I love the climate ramifications of the IRA but am confused by the inflation benefits. Inflation projections over the mid- to long-term seem to be more closely aligned to the Fed’s 2-3% goals…so if we’re trying to solve for near-term inflation, won’t it be tough to do so via climate initiatives that will take years to stand up?
So when can we expect things like utility bills, a carton of milk, or a dozen eggs get back to what they were when Trump was President just a few years ago?
And the unemployment rate?
Thank you for an easy-to-follow digest of the energy provisions of the legislation.
I remain interested how the fossil production elements of the bill will affect inflation (and when that will occur). Those provisions were the extortion fee extracted by Manchin, and I still don’t know how significant they are.
In most of the US, retail electricity prices are well below any reasonable estimate of long-run marginal costs. The map produced by your colleagues provides the basis for this — they left out the roughly $40/MWh marginal cost of new transmission needed to connect new utility-scale renewables in their calculation. Dr. Richard McCann has quantified those for a couple of different ISO regions. When these are added in, only Hawaii, New England, and California have retail rates above marginal costs. For the rest of the country, it would not be inefficient to include the costs of new renewables fully in rates, both cleaning up the energy profile and moving retail rates more in line with long-run marginal costs.
But maybe the costs are negative. New wind and solar resources are costing less than $40/MWh (before tax subsidies), as shown by Lazard 15.0. https://www.lazard.com/media/451881/lazards-levelized-cost-of-energy-version-150-vf.pdf
These are generally displacing natural gas and coal generation now (with currently higher fuel costs) having variable costs more than $40/MWh, even before considering cliimate and health impacts of fossil generation. The addition of these resources should cause REDUCTIONS, not INCREASES in retail rates. And, indeed, this is happening in Hawaii, where new solar costing less than a dime (everything costs more in Hawaii) is displacing oil-fired generation costing more than twice that amount.
My question is on heat electrification: 100% use of heat pumps in the US will produce a winter peak demand greater than summer’s, likely dramatically greater. Wind tends to be low on very hot and very cold days. Hydro is lower during the winter.
What generation mix works well with that new demand profile?
I really like your inflation charts showing the influence of energy costs.
I don’t consider reducing healthcare costs by “negotiating” drug prices a revenue item.
I’ve not seen any straightforward calculation on how CO2 emissions are reduced. “Electrifying” does not help because we are burning more and more fossil fuel for electricity. Please look through ElectrifyingOurWorld.com, which makes the supposition that we first provide ample, 24×7 fission power at 3 cents/kWh using mass production and liquid fuels.
There are 8 billion people on earth and is increasing by 1.5%/yr
There are 3.5 billion acres of arable land.
One person, with a lot of work, can live sustainably on one acre.
Nearly 100 raw materials necessary for modern life will have peaked by 2050. “Peak” meaning the rate of extraction from the earth is decreasing no matter how hard one tries.
In a free market, prices go up if the demand goes up and/or the supply goes down.
A good post. Thank you 🌍🙏