
End Of The Oil Age Preview: Norway’s Fleet Transition To EV
It’s time for another update about progress of Norway’s fleet transition to EV powertrains. As of the end of September 2023, full electric vehicles (BEVs) comprised 23.6% of Norway’s total passenger vehicle fleet, with 675,503 units on the road. Plugin hybrids comprised a further 7.1% (203,323 units). Combined plugin EVs thus formed 30.7% of Norway’s fleet.
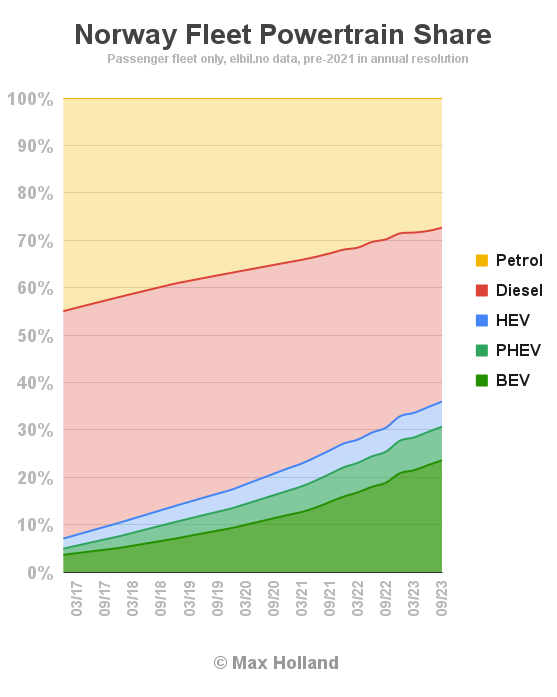
A year ago, at the end of Q3 2022, BEVs were 18.9% of the fleet (and PHEVs 6.6%) for a combined 25.4%. We can thus see that combined plugin EVs have taken an additional 5.3% of the fleet in the past 12 months, with BEVs alone taking 4.7%.
The noticeable upward bump in BEV share at the end of 2022 was caused by the large pull-forward of BEV sales in November and December, ahead of the introduction of sales taxes.
How about the shrinking of the combustion fleet?
Diesel-only vehicles fell from 39.7% share at the end of Q3 2022, to 36.7% at the same point in 2023, a shedding of 3% of absolute fleet share. They currently stand at 1,049,669 units, still the largest single powertrain in the total passenger vehicle fleet (2,861,993 units overall).
Petrol-only vehicles meanwhile fell from 29.8% share down to 27.3% share over the same period. They are currently 781,999 in number.
Here’s a graph showing the changing membership of each powertrain type:
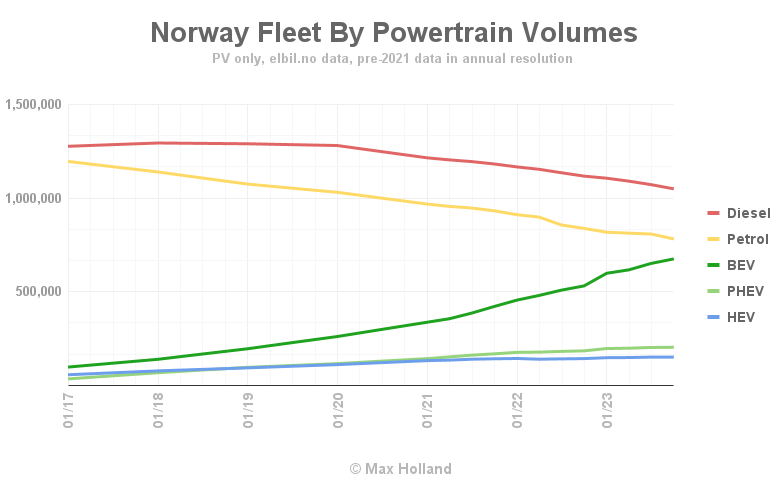
We can see that, in about 6 months from now, the size of the BEV fleet will have overtaken the petrol-only fleet for the first time. On current trajectories, it will be another 18 to 24 months before the BEV fleet overtakes the diesel-only fleet.
Declining Fossil Fuel Sales for Passenger Vehicles?
Many observers of the Norway EV transition are interested in how quickly sales of road fuels for passenger vehicles are declining.
Along with the declining size of the combustion-only fleet, there’s another bonus for declining demand for road fuels. This is that older vehicles typically get driven less than new vehicles. The average BEV is fairly new, whereas — since their sales peak was many years ago — the average petrol or diesel vehicle is around 10 years old (or more). Because of this, the average BEV now actually gets driven a good bit more than the average diesel-only vehicle, and a lot more than the average petrol-only vehicle (latest full year data is for 2022):
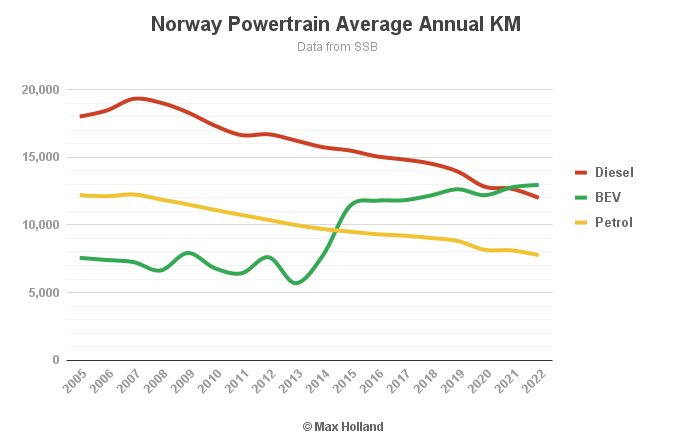
If you want a deeper dive into the correlation between a vehicle’s age and its annual kilometres driven, take a look at my previous Norway fleet analysis from a year ago.
The overall result is that the total annual passenger kilometres that are driven on Diesel or Petrol power are falling, just as those driven on BEV, and to a lesser extent PHEV, and HEV, are increasing. We can see this in the data:

Now compare the slope of these curves with the curves in the “Norway Fleet by Powertrain Volumes” graph we saw earlier. The axis scales are not quite the same, but it should be clear that total kilometres driven for the diesel-only fleet, and petrol-only fleet, are both declining even faster than the absolute size of the respective fleets are declining. This is mainly due to the ageing effect I have outlined.
Besides shrinking and ageing combustion fleets leading to reduced annual kilometres being powered by fuel combustion, one other factor influencing fuel demand is the steadily tightening vehicle emissions regulations, and the increasing fuel efficiency of ICE vehicles over the past decades. This has put further downward pressure on fuel demand. All of these influences together means that demand for passenger vehicle road fuel should be declining at least as fast as the fleet size is declining.
Can we see this in the data?
Diesel road fuel demand is distorted by the fuel sales for vans and trucks so the diesel fuel sales data can’t clearly show the declining passenger vehicle kilometres driven. Petrol road fuel demand, on the other hand, is almost entirely for passenger vehicles, so should more closely correlate with the changing size and total annual kilometres driven of the petrol passenger vehicle fleet.
Here’s a graph comparing the petrol fuel (“Motor Gas”) sales over time, with the petrol passenger fleet’s total annual kilometres driven (in millions of km). Focus on the three curves in the centre:

We can see that petrol (“Motor Gas”) fuel sales, indicated by the dotted curve, are steadily declining over time. I’ve scaled and anchored the fuel sales curve at 2010, to more easily compare with fleet kilometres driven.
The petrol fuel sales are closely correlated with the total passenger fleet annual KM driven on the various types of petrol powered vehicles (olive-green curve), as common sense would lead us to expect.
Last time around, I neglected to include petrol-HEVs, and petrol-PHEVs in the total petrol fleet kilometres driven, entirely by my own oversight. Although these are different powertrains from petrol-only, they do of course use petrol fuel also. In the current analysis, they are now included in the olive-green “Petrol All” curve, whereas the subset of the petrol-only combustion fleet’s total annual kilometres is given by the yellow “Petrol-Only” curve.
Statistics Norway (SSB), the country’s official body for data communication, started tracking the nascent HEV and PHEV fleets and their fleet total kilometres driven in 2016. Since that time, we can see that the growth of HEVs and PHEVs has actually accelerated the decline in petrol fuel sales, relative to the total annual KM driven.
Up until 2015, we can see that the total KM driven by traditional petrol-only vehicles (yellow curve), and the petrol fuel sales (dotted curve), correlated very closely. Fuel sales were declining just a little bit faster than the decline in total petrol-only kilometres driven. This was presumably because of gradually improving fuel economy of the newer petrol-only vehicles joining the fleet.
However, from 2016 onwards, HEVs and PHEVs start being included, represented by the “Petrol All” (olive-green curve), and we can see that the relative divergence grows wider between the kilometres driven and fuel sales. This is because HEVs are a step on in efficiency from petrol-only powertrains, and PHEVs — when used correctly — can drive most of their annual kilometres on electric power only.
Both HEV sales and PHEV sales have fallen away in the past year or so, since BEVs now take almost all new sales (see my monthly sales reports). Each of these hybrids’ share of the fleet will never be substantial – likely peaking at 5.5% for HEVs, and 8% for PHEVs — within the next year or so — and then slowly falling away thereafter. We will continue to see petrol fuel sales quite rapidly declining over time. Although the data for diesel is less tidily correlated, we should assume that diesel fuel sales for passenger autos also are declining faster than the actual diesel fleet annual kilometres is declining.
One more thing to bear in mind is that Norway’s retail road fuels are already mandated to include a roughly 12-15% bio-fuel component, and this percentage will likely increase further over time. Given that the bio-fuel volume will likely remain steady (if not grow) as road fuels decline in volume, this effectively means that the fossil fuel volume of total road fuel sales will decline at an even faster rate.
This fleet total kilometres driven data only gets updated annually, but we will keep tracking the relationship between these variables when these updates arise.
Outlook
This year has seen Norway’s total new car sales slowed a bit (about 10% down YTD), due to a weak consumer economy. Even though BEVs are contributing a greater share of 2023 auto sales than they did in 2022 (85% vs. 79%) the reduced overall volume of auto sales means that the rate of fleet replacement hasn’t accelerated very much, compared to last year. However, the large surge of plugin sales in late 2022, ahead of tax increases in January, has helped boost the trailing 12 month figures. As mentioned above, BEVs have replaced a further 4.7% of the Norwegian fleet over the 12 months, whereas the previous 12 months saw 4.1% replacement.
If we include PHEVs, we are looking at a further 5.3% of the overall fleet converting to plugins, over this past 12 months, compared to 4.7% converting in the prior 12 months. I estimate that if sales volumes match recent yearly norms, we should be looking at 6% of the fleet being converted over per year. If folks accelerate their retirement of their old ICE vehicle for a new BEV in the coming years, the fleet turnover could reach 7% per year.
Even at a conservative 6%, this would bring the fleet to 50% plugin by the end of 2026, and 75% by late 2030. The 25% remaining ancient combustion fleet (including around 5% HEVs) will likely be driving relatively few annual kilometres. Recall that there’s also a proportion of biofuels in road fuel. With these factors combined, the passenger vehicle fleet will likely be using not more than 10% of the fossil fuel volume that it was back in the era of peak-ICE driving (roughly 2008).
If this scenario plays out, the resulting fleet annual kilometres and concomitant fuel consumption might look something like this: (N.B., this is only a very rough and simplified guesstimate):

Here, the fuel sales for passenger vehicles quickly converge on near-zero sometime shortly after 2030. Even by 2030 they are likely in the region of just 10% of what they were back in 2008. The actual scenario could be more abrupt than this, or less abrupt.
Given the cost savings, I would expect commercial vehicle fleets (buses, trucks, vans) to move over to electric kilometres driven at least as quickly as the passenger vehicle fleet, and thus see just as precipitous a drop in their demand for road fuels by 2030. We have much less data about this segment of road transport, but will track what we can as the data arises.
Do you think this analysis paints a likely scenario for Norway’s passenger auto fleet in the coming years? Is the analysis missing some important hidden variables that might play an influence? Bear in mind that the data may not be available to check all possible variables, if you have relevant data, please share it.
Most of all, please jump into the comments section below and join the discussion.
Have a tip for CleanTechnica? Want to advertise? Want to suggest a guest for our CleanTech Talk podcast? Contact us here.
Latest CleanTechnica.TV Video

CleanTechnica uses affiliate links. See our policy here.