(More) Breaking News! California Electricity Prices are Still High!
Is it deregulation or is it just California?
An article last week in the New York Times drew new attention to the ongoing debate about the impacts of electricity deregulation, stating that “some experts blame deregulation” for high electricity prices. It argues that “states that have deregulated all or parts of their electricity systems tend to have higher rates.” This isn’t the first time this debate has made the news. A multipart NY Times series explored this topic in 2006-07, and in 2017 a related LA Times article inspired a blog with a very clever title.
Can high prices be traced to deregulation? Severin Borenstein and I have looked at this question several times, most extensively in our 2015 paper looking at the first 20 years of the deregulation period. While it’s a difficult question to answer, it turns out that you have to squint pretty hard, and have some selective definitions of deregulation, to say the answer is “yes.”
What is Electricity Deregulation and Where Was it Implemented?
There are several factors that complicate the question “did deregulation lower electricity rates?”
The first complication is that there is no simple definition of “deregulation.” In 2015 we had to devote half the paper to exploring all the ways you could define deregulation. Utilities in some states, like Virginia, joined regional markets run by Independent System Operators (ISOs) but kept their generation regulated. Other states, like Michigan, opened up at least some retail service to competition, but changed little else. Still others, like Kansas, have slowly restructured by steadily expanding the output of non-utility generation while never really touching the existing utility structure. Of course, two states usually lead the list when it comes to discussions about electricity deregulation: Texas and California. Texas has gone the farthest down the deregulation path with extensive retail competition and market-based generation compensation. California had its famously disastrous experience with market-based generation and retail in the early 2000’s and has largely kept the lid on retail competition ever since, with the exception of community choice aggregation.
Severin and I have largely thought the best single measure of “deregulation” centers on the degree to which generation is compensated by market-based prices rather than cost-based regulation. In 2015 we divided the U.S. into deregulated and regulated based upon that metric.
A second complication is that retail prices in States that deregulated were already very high. That’s a big part of why they deregulated! So any comparison of retail prices needs to be mindful of different starting points.
A third complication, one we emphasized in 2015, is that prices in deregulated markets more closely follow marginal generation costs, which are in turn more volatile than the long-run average costs that form the basis of prices in regulated states. In the U.S. this means that electricity prices follow natural gas prices, the typical fuel for marginal generators, much more closely in deregulated states. When gas is expensive, deregulation looks like a bad deal. When gas is cheap, deregulation looks a lot better.
 (Source: based on Energy Information Administration state level average retail price, weighted by MWh)
Many of these patterns are illustrated in the above graph, updated from the 2015 paper with data through 2021. In this version I have also adjusted for inflation (something I forgot had ever existed in 2015), so all prices are in 2021 cents/kWh. You can see that states that eventually deregulated between 1998 and 2002 had higher prices many years before. It also shows that the price gap with regulated states grew during the mid 2000s, during which deregulated states were more impacted by rising natural gas prices. After 2008, the gap narrows when the fracking boom drives gas prices back down. After adjusting for inflation the gap between the regulated and deregulated states, while noisy, has continued to narrow and is now smaller than it was before deregulation began.
One last complication in studying electricity prices is that the cost of buying electricity comprises at most half the retail price in most states. The costs of transmission, distribution, which remain regulated everywhere, along with a myriad of other charges, make up half or more of the retail price. The effect of these non-generation elements can be dramatically illustrated by breaking out California from the above graph.
 (Source: based on Energy Information Administration state level average retail price, weighted by MWh)
The California Effect
When we remove California from the “deregulated” group, you can see how dramatically California’s prices have gone in the opposite direction of the other deregulated states. The sharpest climb in California electricity rates has hit in the last five years, complicating any attribution to the deregulation process in 1998. After removing California, retail prices in all the other deregulated states have risen more slowly than those in the regulated category. The gap between those two groups, in real terms, is now about half of what it was in 1998.
So instead of “some experts blame deregulation,” a better sub-title for last week’s article would probably be “experts should blame California.” This takes us back into the long-running, many-faceted discussion about why California electricity prices are so high, and seem to be diverging more and more from the rest of the U.S. The post-2010 trend is telling here, as it coincides not with the timing of deregulation, but instead with the start of California’s aggressive commitment to reduce carbon emissions and, more recently, the rapid expansion of wildfire related costs.
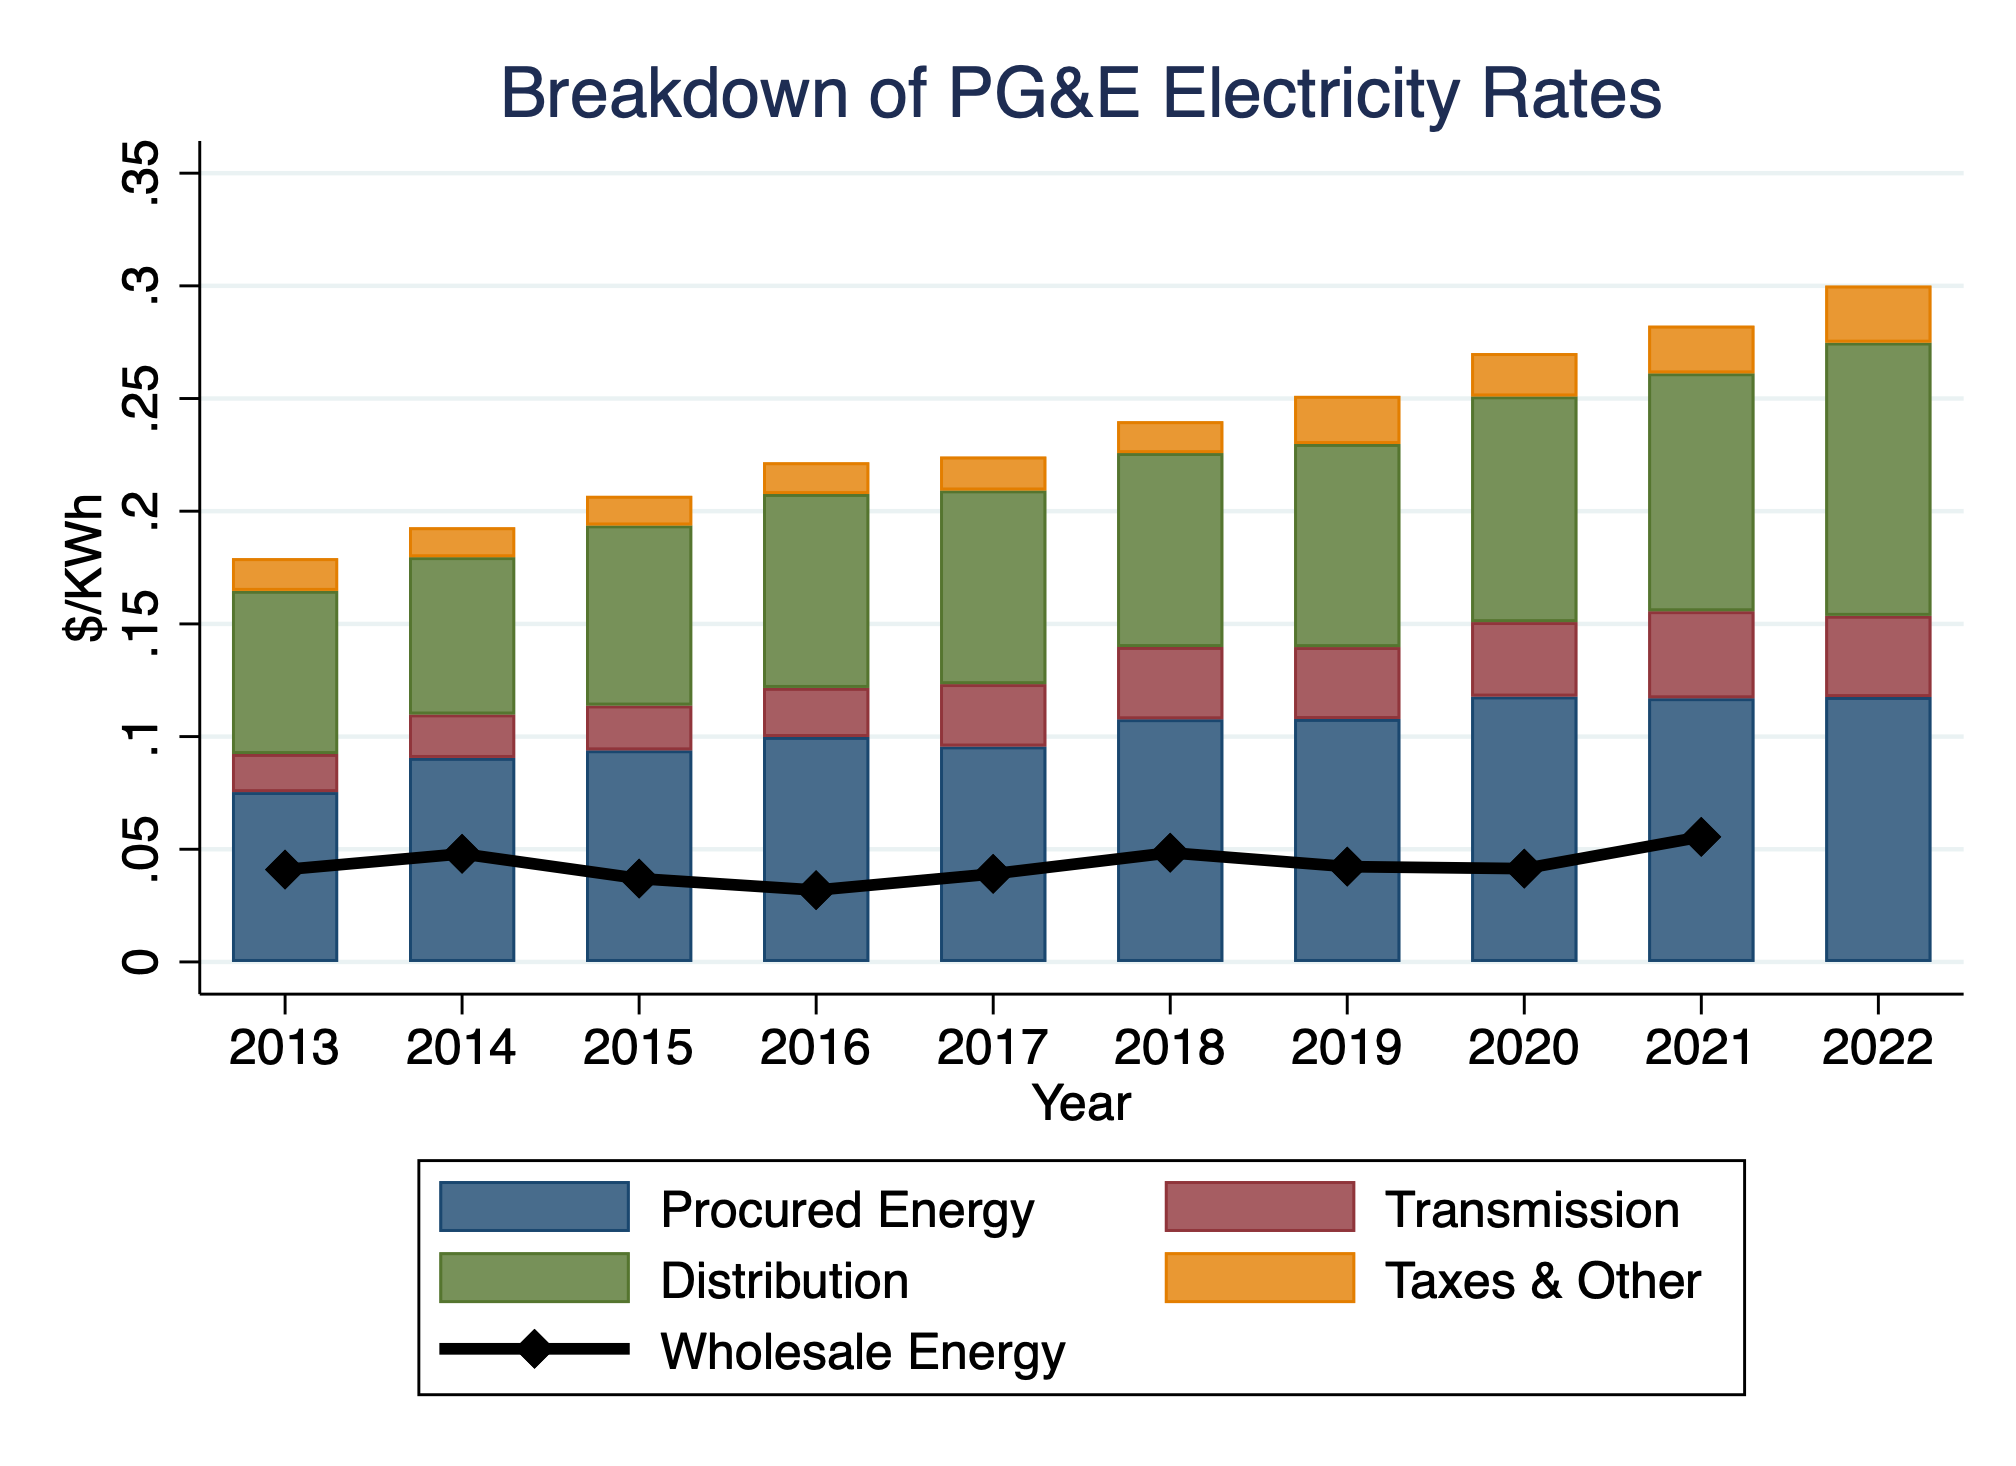 This breakdown of PG&E’s rates illustrates the sources of the increases. All components have risen since 2013, with the largest percent increases hitting the distribution and “other” category. This latter category includes wildfire costs, which are now approaching half a cent per kWh. An important fact to consider is that all of these categories are absorbing the cost-shift created from rooftop solar. These costs are estimated to have added 2-3 cents/kWh to prices in PG&E’s territory in 2019, a figure that has surely increased since then as residential rates and solar PV adoption have risen.
So California’s rising prices can be traced to higher energy procurement costs, increases in transmission, and most significantly, distribution costs. The Times article tries to make a connection between transmission spending and deregulation, arguing that “utilities in deregulated states have financial incentives to build transmission lines.” Actually utilities in every state have a financial incentive to build transmission lines, it’s called rate-of-return regulation, and it continues in every state in the country.
I do believe that regions with Independent System Operators have managed to build more high-voltage transmission over the last 20 years, largely because they have proven to be an effective vehicle for coordinating planning and cost recovery across multiple states and utilities. By far the largest expected driver of transmission expenditures, however, is the need to support renewables expansion. An expansion on which California sits on the cutting edge.
Several blog posts on this site have noted this decarbonization conundrum. On the one hand, we want more people to shift their transportation and heating uses to electricity because electricity is much cleaner (at least in California). On the other hand, the process of decarbonizing the grid and the impacts of climate change are contributing to ever-higher electricity prices, creating significant challenges for expansion of electric vehicles and appliances.
Managing the dual goals of decarbonizing electricity and expanding electrification requires a delicate balance of policies, as well as a power market and utility regulatory process that is more efficient and effective. This starts with a more rigorous understanding of why electricity prices are where they are.
Notes: (1) In the 2015 paper we defined deregulated states as states where 40% or more of their electricity was produced by Independent (e.g. non-utility) Power Producers. This was 16 states: CA, CT, DE, IL, MA, MD, ME, MT, NH, NJ, NY, OH, PA, RI, TX, and VT. I exclude DC, HI, and AK from these graphs. The NY Times article states that 35 states were deregulated but does not list which ones, or exactly what definition of deregulated was used.
Since 2012, three additional states, KS, SD, and OK have increased their IPP share above 40% but I did not include them in the deregulated category. The MacKay and Mercadal paper cited in the article considers 17 states to be deregulated, including Virginia, Michigan, and Oregon, the latter of which is highlighted in The NY Times article as an example of a regulated state. We did not consider any of these three to be deregulated.
(2) Prices in the comparison graphs are the sales-weighted average for all electricity sales in the two groups of states.
(3) The breakdown of PG&E rates is taken from the January PG&E Bill of a representative customer. Wholesale energy prices are the annual average cost of energy in the CAISO market, while “procured energy” is the energy component of the PG&E bill.
Keep up with Energy Institute blog posts, research, and events on Twitter @energyathaas. Suggested citation: Bushnell, James. “(More) Breaking News! California Electricity Prices are Still High!” Energy Institute Blog, UC Berkeley, January 17, 2023Categories

Looking at this workpaper referenced in the NY Times article would be helpful as a comparison to the analysis presented in this blog post:
Click to access 21-095_e526adad-0e9e-4d28-88e4-7b8b6f434658.pdf
Two thoughts:
1) While rates for restructured states outside of California have fallen relative to regulated states, is the apparent increase in volatility worth those savings? The average dilutes the volatility within a state. In addition, rates in 2022 were and are expected for 2023 to be much higher. Presumably those are more likely in the restructured states given the volatility.
2) California’s dilemma really began back in the 1980s with the combination of Diablo Canyon + SONGS and the excessive payments to QF cogenerators (Standard Offers 2 and 4 double levelized the capacity payments!). The initial round of restructuring grew out of industrial customers threatening to self generate. Then after the crisis, the state gave back 4 cents a kWh to the utilities and generators through the DWR contracts. That 4 cent increment carried through to 2011 so it looked like costs were under control. While rates fell a small amount up to 2013, then the next round of excessively priced procurement restarted the rate pressure that has been there for almost four decades.
Meanwhile, rooftop solar has created up to $4 billion a year in benefits from avoided generation and transmission spending since 2006. Most of that is missing from the accounting I’ve seen on that resource.
This report may be of interest-
Click to access 2022-sb-695-report.pdf
Table 10: Transmission Revenue Requirement,
January 1, 2016 and January 1, 2022
notes the rather large average annual increase in PG&E’s allocation compared to SCE and SDG&E’s.
PG&E1.183 billion $ 2.706 billion 21.5%
SCE $ 1.177 billion $ 1.491 billion 4.4%
SDG&E $ 0.531 billion $ 0.773 billion 7.6%
I would be interested in a further breakdown in costs wihin California between the major energy suppliers like PG&E and the Municipal Utilities Districts (MUD). The MUD systems seem to have much lower prices. See:
Click to access Residential-Rates-Plan-Pricing.pdf
https://www.smud.org/en/Rate-Information/Residential-rates
https://www.alamedamp.com/DocumentCenter/View/1061/D1-Rate-Schedule-Effective-2022-7-1
Why is this? I assume MUD’s are non-profit. Are their lower costs because they are not beholden to shareholders? Because they appear to cover a smaller area, are their distribution costs lower? Would it make sense for more communities to set up MUD’s to lower electricity costs?
Good questions all! Thanks for the references.
Whenever such discrepancy exist my thinking goes to lobbyists essentially ‘manipulation’ and potentially corruption. Collusion between CPUC and the deregulated providers. Whenever there is need to improve or recover from fires / accidents ratepayers get hit up. What exactly is the point of ‘depreciation’ write offs if in the end they will jack up rates!!
Thank you for the study and the article. I would be interested to see this study performed on a total electricity bill basis rather than a rate basis. This could further help to answer the question about how much more expensive electricity has (or has not) become in California since the 1990’s.
In California, the consumers live mostly along the California Coast while the solar generation is produced in the interiors desert valleys that require more transmission lines to get from point “A” to point “B”. Rooftop solar is on the homes in those highly populated areas and do not need long-distance transmission lines because the power stays right in the neighborhood. NEM 3.0 does not take the lower cost into consideration. NEM 3.0 takes away 75% of the value of the energy produced yet if you take away transmission and distribution costs, the real value of the energy produced would be far greater than the 5 to 7 cents being offered by the utilities, and far more than the 3 cents currently being offed all solar customers at true-up time. The chart shows the procurement costs today at about 12 cents per kilo watt hour which would be more like a 50% reduction in retail value than the 75% the CPUC and the utilities are offering. NEM 3.0 will kill the very needed rooftop solar expansion, putting many smaller solar contractors out of business and ending all solar leases that are being used by lower income middle class homeowners. Existing rooftop solar customers will no longer get customer support from the defuncted contractors or solar serviced businesses just like the hot water solar customers in the 1970s when the incentives were ended in California for solar hot water panels on roofs. The mandated rooftop solar on all new homes will also burden the consumers with larger 30-year home mortgages to cover the solar that will not even cover the interest payment for the added on solar. $24,000.00 X .05 = $1,200.00 in interest a year but NEM 3.0 will only give the homeowner $600.00 to $800.00 in energy value, depending on how much energy they can actually burn up during the day instead of the $2,400.00 they would have received in generated value under NEM 2.0 in banked energy after the utility takes away the 75%.
It is amazing how the Energy Institute manages to get its closely held bias against rooftop solar worked into most every post. There was no reason to bring it up in this one in such a gratuitious manner.
It woldl be fair enough to mention how all of the public interest charges added to rates show how regulation is is very strong component of our rates, which of course belies the term “deregulation”. But if one is going to do that it only fair to talk about all of them such as the various low-income programs, retrofitting, etc. Some of these programs actually reduce the need for generation while others increase it.
The State for good or ill as chosen to fund these public benefit programs through rate-payers. It is a fair question to ask what return the ratepayers (as opposed to the State) gets for that. Each of these public benefit programs has a constituency that benefits more than others.
The State has decided that is a public benefit to help low-income households pay for their fuel bills. The State has decided that is a public benefit to increase rooftop solar generation. Both of these require subsidies that benefit those who take advantage of them. It is a shame that the Energy Institute hides its biases while claiming to do simple economic analyses.
This post recognizes the difficulty of defining “deregulation” in the electricity industry. Puget Sound Energy has procured the vast majority of its power from other suppliers for 50 years. Yet it remains a “regulated” utility providing bundled service (except to the largest industrial customers, who procure power independently) in a “regulated” state.
Texas is the most deregulated, to be sure, where every consumer must choose a power supplier. The New England states, where the retail distribution company does not provide the kilowatt-hours, except through standard offer service procured competitively are arguably “deregulated”. Then there are states like Michigan and Illinois, where some customers take regulated service, and some buy in the competitive market.
I was involved in deregulation dockets in many states and provinces in the 1990 – 2010 era. The most entertaining was British Columbia, where halfway through the docket the industrial customer group realized that they currently had the lowest industrial electricity prices in the world, and that things were unlikely to improve from that state. They switched positions mid-docket.
This post suggests there has been little impact. But my own observation is that it was the high-cost states (California and New England) that pursued deregulation (plus Texas, which is still only reluctantly a “state.”) Given the high rate position from which they started, clearly the GOAL was to suppress future increases…and that has not happened. One might view that as a failure of deregulation. The high cost states (California and New England) are still the high-cost states.
I’ll note from one graphic above, the “Breakdown of PG&E Prices” that the PG&E transmission and distribution costs have increased dramatically over the study period. But certain analysts at Haas continue to assert very low marginal T&D costs for California. In general, the way that average costs rise is when marginal costs are higher than average costs, that is, we are on the increasing-cost side of the marginal cost curve.
