article thumbnail

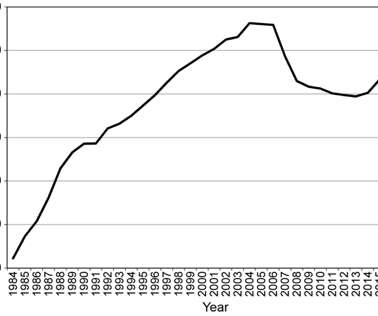
Distance driven per person is still down from its maximum in 2004

Green Car Congress

from 1984 to 2004 (from 6,612 miles to 9,314 miles). from 2004 to 2013 (from 9,314 miles to 8,472 miles). from 2013 to 2018 (from 8,472 miles to 8,855 miles). In conclusion: Distance driven per person reached its maximum in 2004. This rate is on a rebound since 2013, but it is still down by 4.9%

2004 322
article thumbnail

Distance driven in the United States: Did we reach the peak in 2004?

Green Car Congress

from 1984 to 2004 (from 6,612 miles to 9,314 miles), then decreased by 9.1% by 2013 (to 8,468 miles), and then increased by 4.3% from 1984 to 2004 (from 18,256 miles to 24,349 miles), then decreased by 10.2% by 2013 (to 21,866 miles), and then increased by 4.3% by 2013 (to 21,866 miles), and then increased by 4.3%

2004 317
article thumbnail

Study finds rates of LDV fuel consumption in US peaked in 2004; indications of peak motorization

Green Car Congress

These rates are down 16% to 17% from their peaks in 2004, except that the rate per vehicle is down 13% (from its peak in 2003). This rate increased to a maximum of 474 gallons in 2004. The rate increased to a maximum of 698 gallons in 2004. The rate increased to a maximum of 1,240 gallons in 2004. 2003 to 2004. -13%

2004 252
article thumbnail

EPA: US greenhouse gases up 2% in 2013; increased coal consumption, cool winter

Green Car Congress

US GHG emissions by sector, 1990-2013. Total US greenhouse emissions were 6,673 million metric tons of carbon dioxide equivalent in 2013, an increase of 2% (127.9 over the prior year, according to the EPA’s newly published Inventory of US Greenhouse Gas Emissions and Sinks: 1990–2013. from 1990 to 2013. from 1990 to 2013.

2013 150
article thumbnail

Great Britain and the United States show the same pattern of recent changes in vehicle distance traveled

Green Car Congress

above the 1993 value, while in the United States the peak distance (in 2004) was 14.6% A substantial decrease between the mid 2000s and 2013. decrease from the peak in 2007 to 2013, while in the United States there was a 6.6% decrease from the peak in 2004 to 2013. A modest increase (rebound) between 2013 and 2018.

article thumbnail

Gasoline consumption per capita in 2020 was on par with that in 1965

Green Car Congress

Total consumption (millions of gallons). Consumption per capita. Consumption per capita (gallons). Consumption per capita (gallons). The maximum consumption per capita (505 gallons) was reached in 1978.

2020 415
article thumbnail

Number of vehicles in the United States: Did we reach the peak in 2006?

Green Car Congress

Distance driven per person reached a maximum in 2004. While this rate has been on a rebound since 2013, the 2017 rate is still down from 2004 by 5.2%. In a recent article , I examined changes in distance driven in the United States during the period from 1984 through 2017. population).

2006 277