article thumbnail

Latest GHG Inventory shows California remains below 2020 emissions target; much steeper rate of GHG reductions required

Green Car Congress

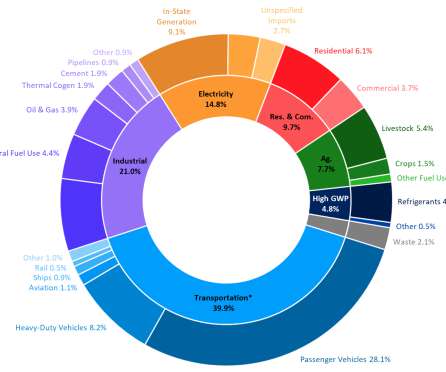
The data shows a slight increase in overall emissions from the previous year, and a slight decline in emissions from transportation, which is the state’s main source of both GHGs and air pollutants. Per capita GHG emissions in California have dropped from a 2001 peak of 14.0 Source: California Air Resources Board (ARB).

2020 221
article thumbnail

Satellite study suggests California clean air regulations working to reduce PM2.5 emissions in state

Green Car Congress

pollution in the state. is especially burdensome in California and accounts for the greatest percentage of health impacts attributable to air pollution. km-resolution MISR aerosol properties over Southern California for years 2001–2003, 2007–2009 and 2013–2015. to predict PM 2.5 Most monitors do not track individual PM 2.5

article thumbnail

California ARB: GHG emissions fell below 1990 levels for first time in 2016; down 13% from 2004 peak; transportation emissions up 2%

Green Car Congress

The state’s latest Greenhouse Gas Emissions Inventory shows that California emitted 429 million metric tons of climate pollutants in 2016—a drop of 12 million metric tons, or three percent, from 2015. They fell 23% from a peak of 14 metric tons per person (roughly equal to driving 34,000 miles) in 2001 to 10.8

2004 225
article thumbnail

Motiv Power Systems delivering 7 electric walk-in vans to USPS as part of CARB program; deployment in Central Valley

Green Car Congress

Most of the immediate project benefits will accrue in the San Joaquin Valley, an economically disadvantaged area with some of the highest pollution burdens in the country, as evidenced by CalEnviroScreen scores within the worst five percent in the state.

Parts 220
article thumbnail

Study Highlights the Importance of Considering Climate Effects of Non-CO2 Emissions from Transport in Mitigation Strategies and Policies

Green Car Congress

The on-road transportation (ORT) and power generation (PG) sectors are major contributors to CO 2 emissions and a host of short-lived radiatively-active air pollutants, including tropospheric ozone and fine aerosol particles, that exert complex influences on global climate. Unger et al. Click to enlarge. Unger et al.

Climate 150
article thumbnail

ICCT analysis finds real-world vehicle fuel consumption gap in Europe at all-time high of 42%

Green Car Congress

However, says Dr. Peter Mock, Managing Director of ICCT Europe, since 2001 Europe has seen the largest increase in its gap. As a result, less than half of the on-paper reductions in CO 2 emission values since 2001 have been realized in practice, ICCT says. —Peter Mock. —Uwe Tietge.

Europe 170
article thumbnail

EPA proposes approval of new ozone plans for the two of the worst Air Quality Zones in US: California’s San Joaquin Valley and South Coast

Green Car Congress

The two areas suffer from some of the worst air quality in the country due to a number of factors, such as meteorology, geography, climate and weather. These new SIPs demonstrate that, by 2024, pollution will be reduced to the level needed to attain the 1997 8-hour ozone standard of 0.08 Earlier post.).

Ozone 236