
USA & China Electricity Generation TWh & CO2e Trajectories Since 2000 Are Startling
For a decade I’ve been tracking the exponential expansion of wind, solar, and to a lesser extent hydro electricity generation in China, mostly against nuclear generation’s much flatter growth trajectory. In recent years I’ve been looking at other aspects of generation, in part because of the regular refrain of delayers and deniers who use “But China…!” in every other argument.
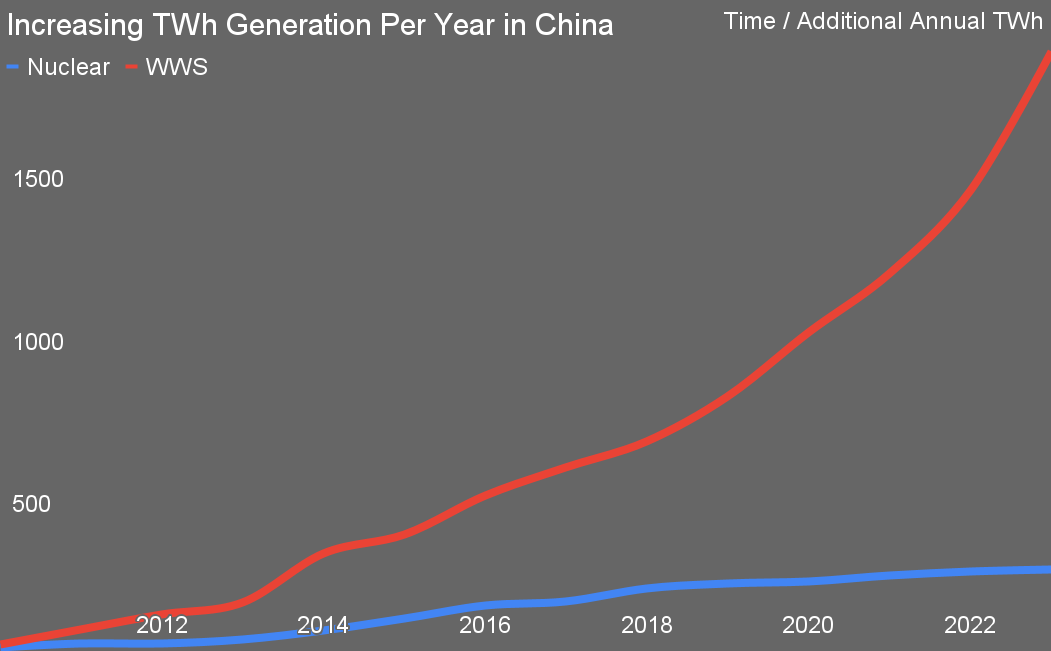
This chart is the increase in TWh of new generation — not capacity, but actual generation adjusted for capacity factors of different forms of generation — as experienced in China since 2010. For this series, I chose 2010 as a start date because the wind, solar, and nuclear programs were mature enough that starting pains should have been in the past. The nuclear program was about 15 years old at the time and the wind and solar programs were about five years old.
The renewables curve shows accelerating growth, but the nuclear curve has flattened out in recent years after peak growth in 2016 and 2018. In 2023, only 1.2 GW of new nuclear capacity was added to the grid.
It was only in recent years that I added hydro, as China is building more dams than the rest of the world combined as well, with the biggest by one measure, the Three Gorges Dam, entering commercial operation in 2012. It’s dwarfed by a dam under construction in the far west of the country which is expected to enter operation in the mid-2030s.

I spent some time late last year considering the reports of massive construction of coal plants, leveraging global data sets to find that while that was indeed true, the reality was more nuanced, with three-quarters as much coal capacity shelved or canceled without completing construction or mothballed or retired from operation.
China also uses its coal plants in the same manner that the USA uses gas plants, as peakers and generation of close to last resort. In general, if wind, water, solar, and nuclear electrons are available, they’ll be purchased before gas electrons are purchased in the USA. In China, coal is last in the merit order. This shows up in utilization figures, with gas in the USA and coal in China running around 50% of capacity.
That doesn’t mean China isn’t generating a lot of electricity from coal generation, but the story around coal is more nuanced in three ways. First, while China was building a lot of coal generation, it was building much more renewable generation. Second, the coal generation wasn’t being used as baseload, but at much lower capacity factors. And third, a lot more coal was being shut down, especially lower efficiency coal, than most people realized.
That’s been showing up in the carbon intensity of China’s electricity. In 2023, China saw a carbon intensity below 550 grams of CO2 per kWh. Naturally, someone asked what the trajectory was and how it compared to the USA.
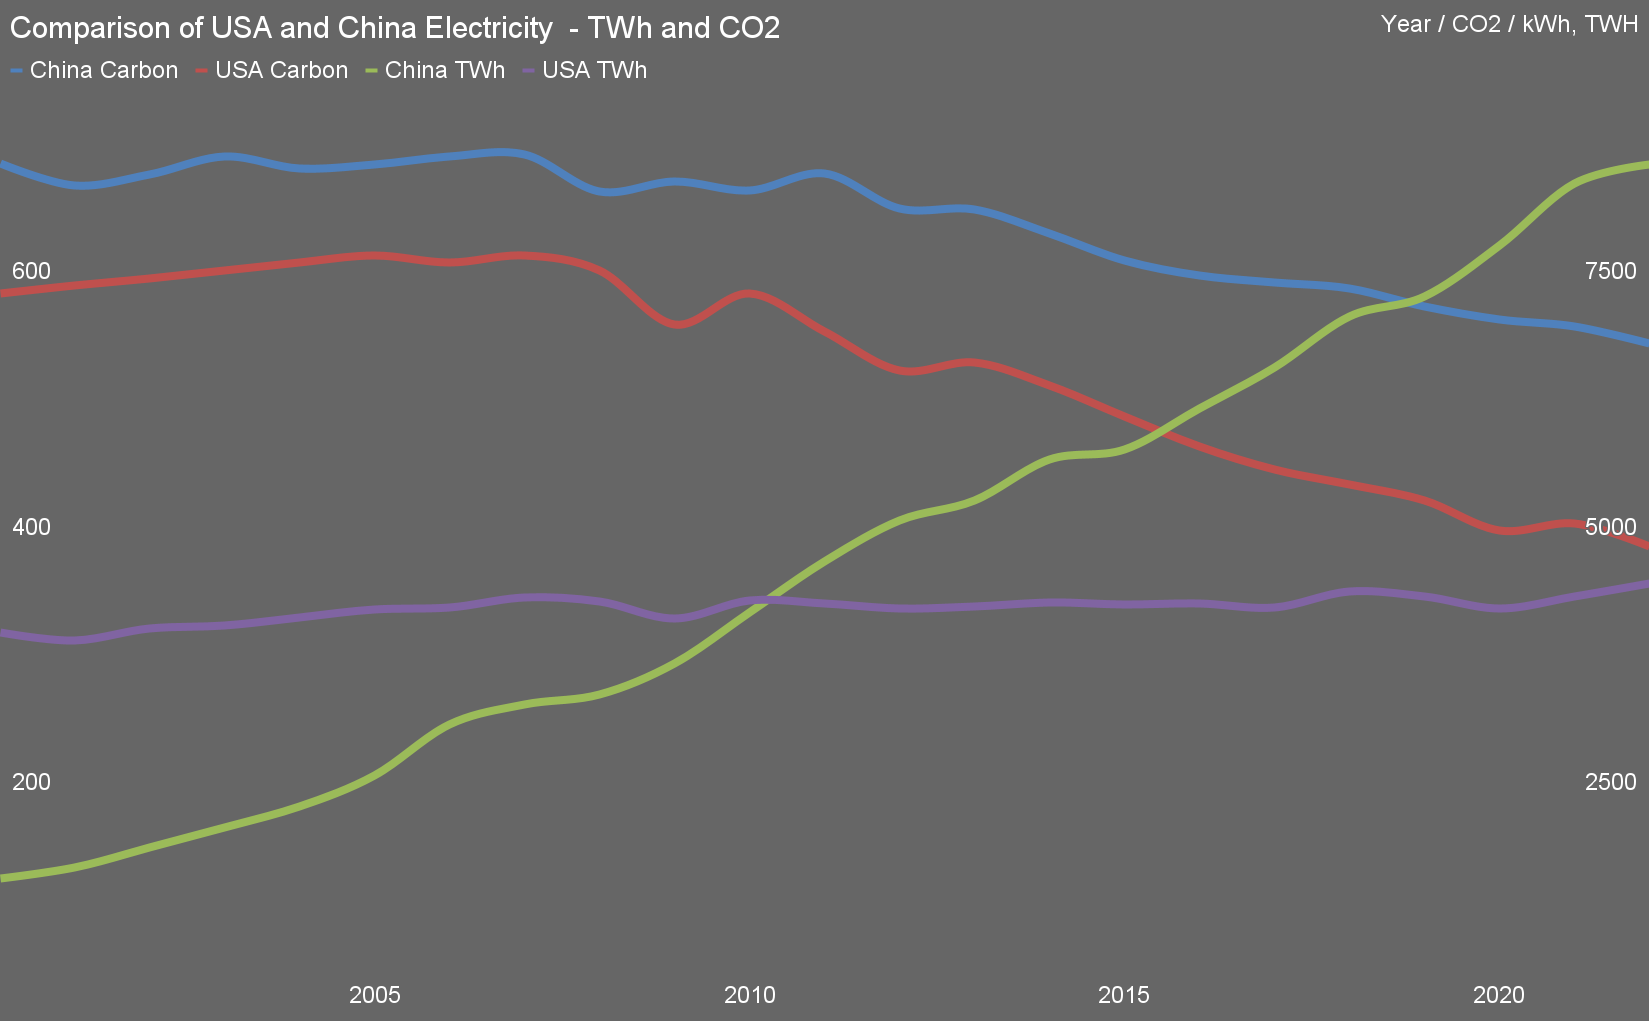
I assembled this chart from US EIA, Statista, and other data sets, normalizing units as the US data wasn’t neatly reported in metric units in data sets I had access to.
There are two trends and data sets on the chart. The right axis and the China TWh and USA TWh lines show how much electricity the countries have been generating. Since 2000, China has gone from generating about a third of the electricity that the USA does to generating about double, a factor of six change in ratio.
In part that’s because the USA’s electrical generation has been stagnant for years. Some of that is due to some efficiency measures, but far from all of it. USA’s efficiency metric of energy services vs rejected energy — almost entirely waste heat from burning fossil fuels — hasn’t really budged since 2015. The USA really isn’t electrifying its economy or building renewables quickly.
What the USA has been doing for a long time is replacing coal plants with gas plants. That shows up in the trends from the left vertical axis and the China Carbon and USA Carbon lines. Those are in grams of CO2 per kWh.
 Chip in a few dollars a month to help support independent cleantech coverage that helps to accelerate the cleantech revolution!
The USA’s emissions improvements are almost entirely due to shifting to gas, which does indeed have lower carbon dioxide emissions when burned, about half of the best of supercritical coal plants burning high-quality coal. But in recent years it’s become apparent that the USA’s natural gas has a nasty methane habit which adds about 300 grams of CO2e to every kWh and that’s not captured in these numbers. Yes, the USA’s carbon emission reductions in electrical generation are overstated in official numbers right now.
This doesn’t mean China’s are better. There’s a lot of methane released from coal beds as well, and there are few good, normalized data sets about coal seam methane vs natural gas methane. I haven’t seen one yet or developed my own, so if someone has a good one, please let me know.
What it does mean is that both CO2 curves underrepresent the actual carbon intensity of the countries’ electrical generation systems. Given the shift of China’s generation toward renewables and to a lesser extent nuclear generation instead of to gas, it’s probable that the curves are at least somewhat more in China’s actual favor, but from the data I assembled today, it’s unclear.
Both of those downward trajectories are good, and to be clear the USA’s would still be downward even if shallower methane emissions were counted. Assuming that they are roughly accurate, China’s grid emissions per kWh in 2022 were below the USA’s grid carbon intensity from 2011. That’s not a carbon intensity that anyone in the USA or probably the developed west expects, given the narrative in recent years. I’m sure that there will be comments in various places about China’s data being corrupt or incorrect. Please note the lack of methane emissions in the USA’s data before trying that on.
But China is electrifying its economy much more quickly than the USA is as well. China has 44,000 km of electrified high-speed passenger and freight rail, while the USA has about 140 km of higher-speed electrified passenger rail and no electrified heavy rail. China has massive electrified transit systems in all of its cities, including around 700,000 electric buses, while most US cities have much weaker transit systems and few non-diesel buses. China has over 500,000 electric trucks on its roads, while the USA is just getting started. Of course, China is by far the world’s biggest market for electric vehicles of all sizes, from personal mobility devices like skateboards and scooters to e-bikes to cars. China has a pair of 700-unit container ships running 1,000 km routes on the Yangtze powered by swappable batteries.
Given the much greater efficiency of energy pathways that are renewables to electricity, China is heading for a tipping point where its carbon emissions for its economy are going to go down rapidly. Buses and cars running off of China’s current electricity are lower carbon by far than gasoline and diesel vehicles and get better with every drop in electricity carbon intensity.
With 2023 marking peak gasoline in China and 2024 marking peak petroleum demand per Sinopec, 2024 marking peak coal demand per Latham Group, low penetration of natural gas in the Chinese market and several other overlapping factors, China’s emissions are heading for a cliff. The USA’s are heading for a shallow downward slope.
Have a tip for CleanTechnica? Want to advertise? Want to suggest a guest for our CleanTech Talk podcast? Contact us here.
Latest CleanTechnica.TV Video

CleanTechnica uses affiliate links. See our policy here.